The trustable AI for data science.

Upload your data, describe what you need. Nveil processes, analyzes, and visualizes with real math, not guesses.
Open source. Reproducible. Verifiable. No code required.

Backed by our partners

app.nveil.com
How it works
01

Upload your files

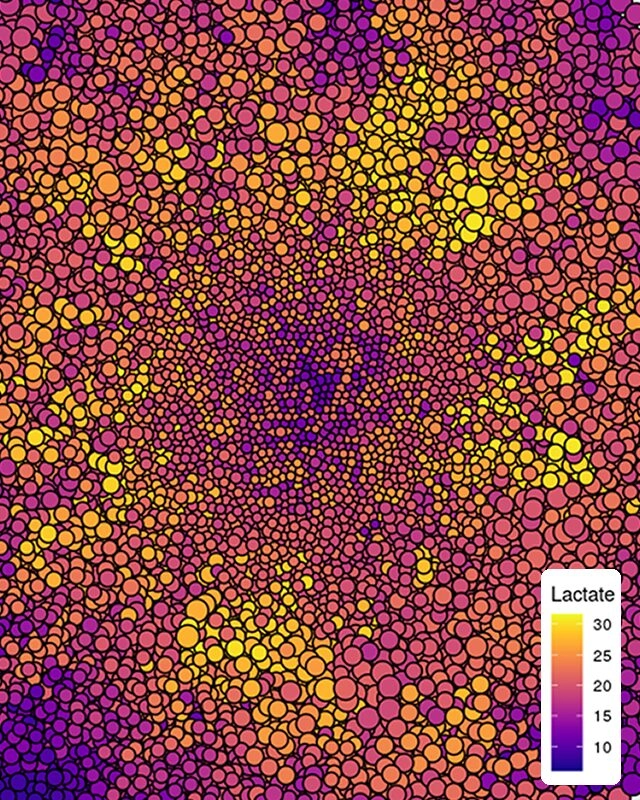
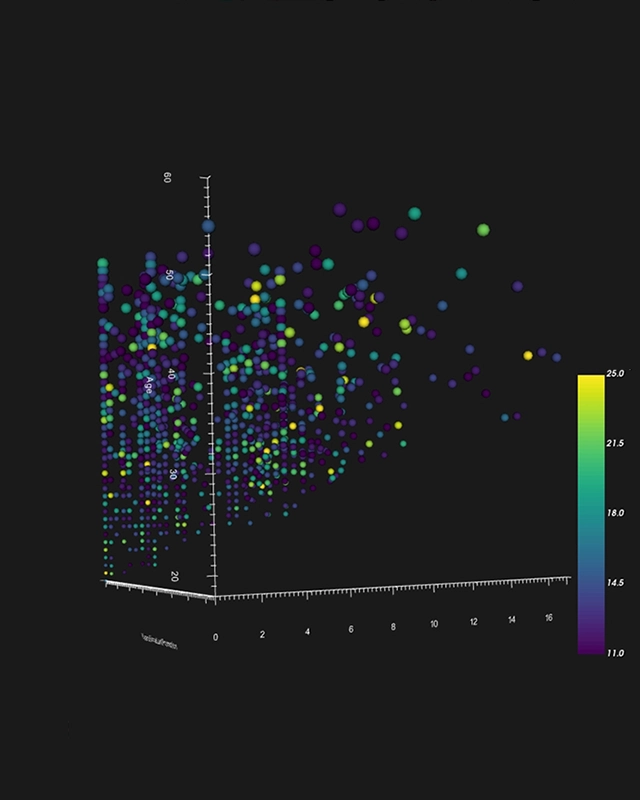
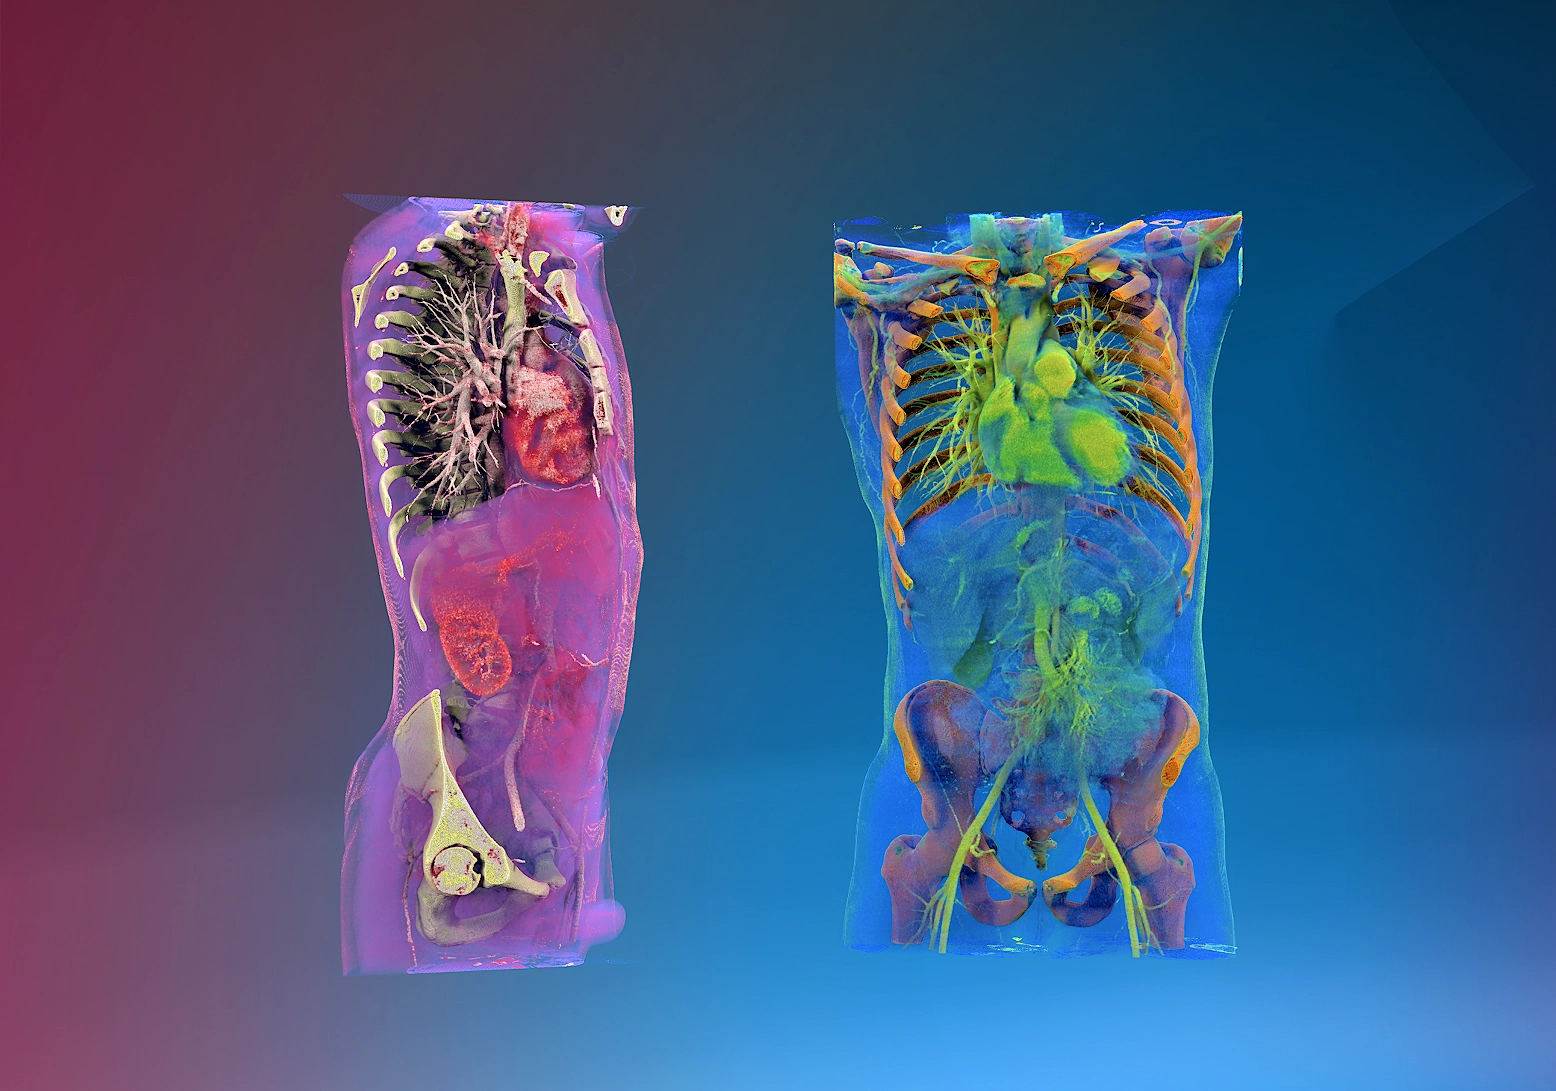
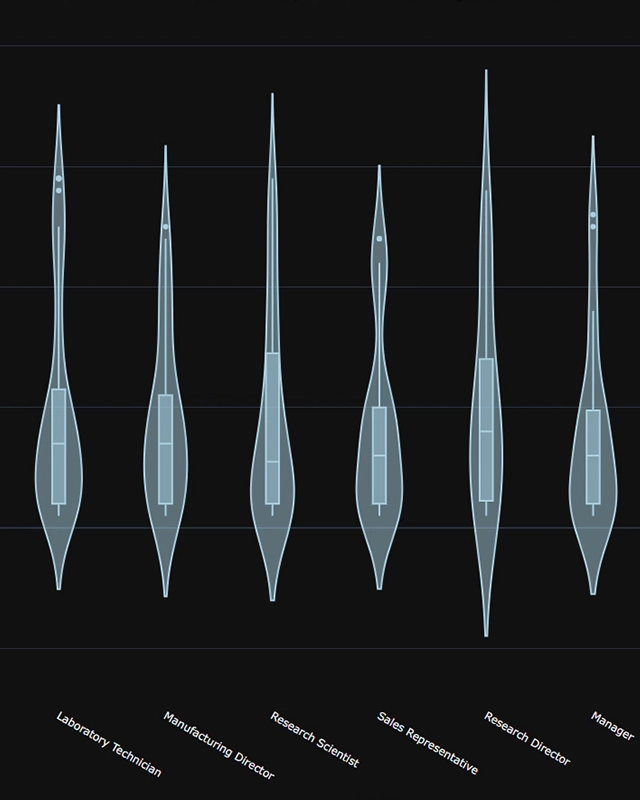
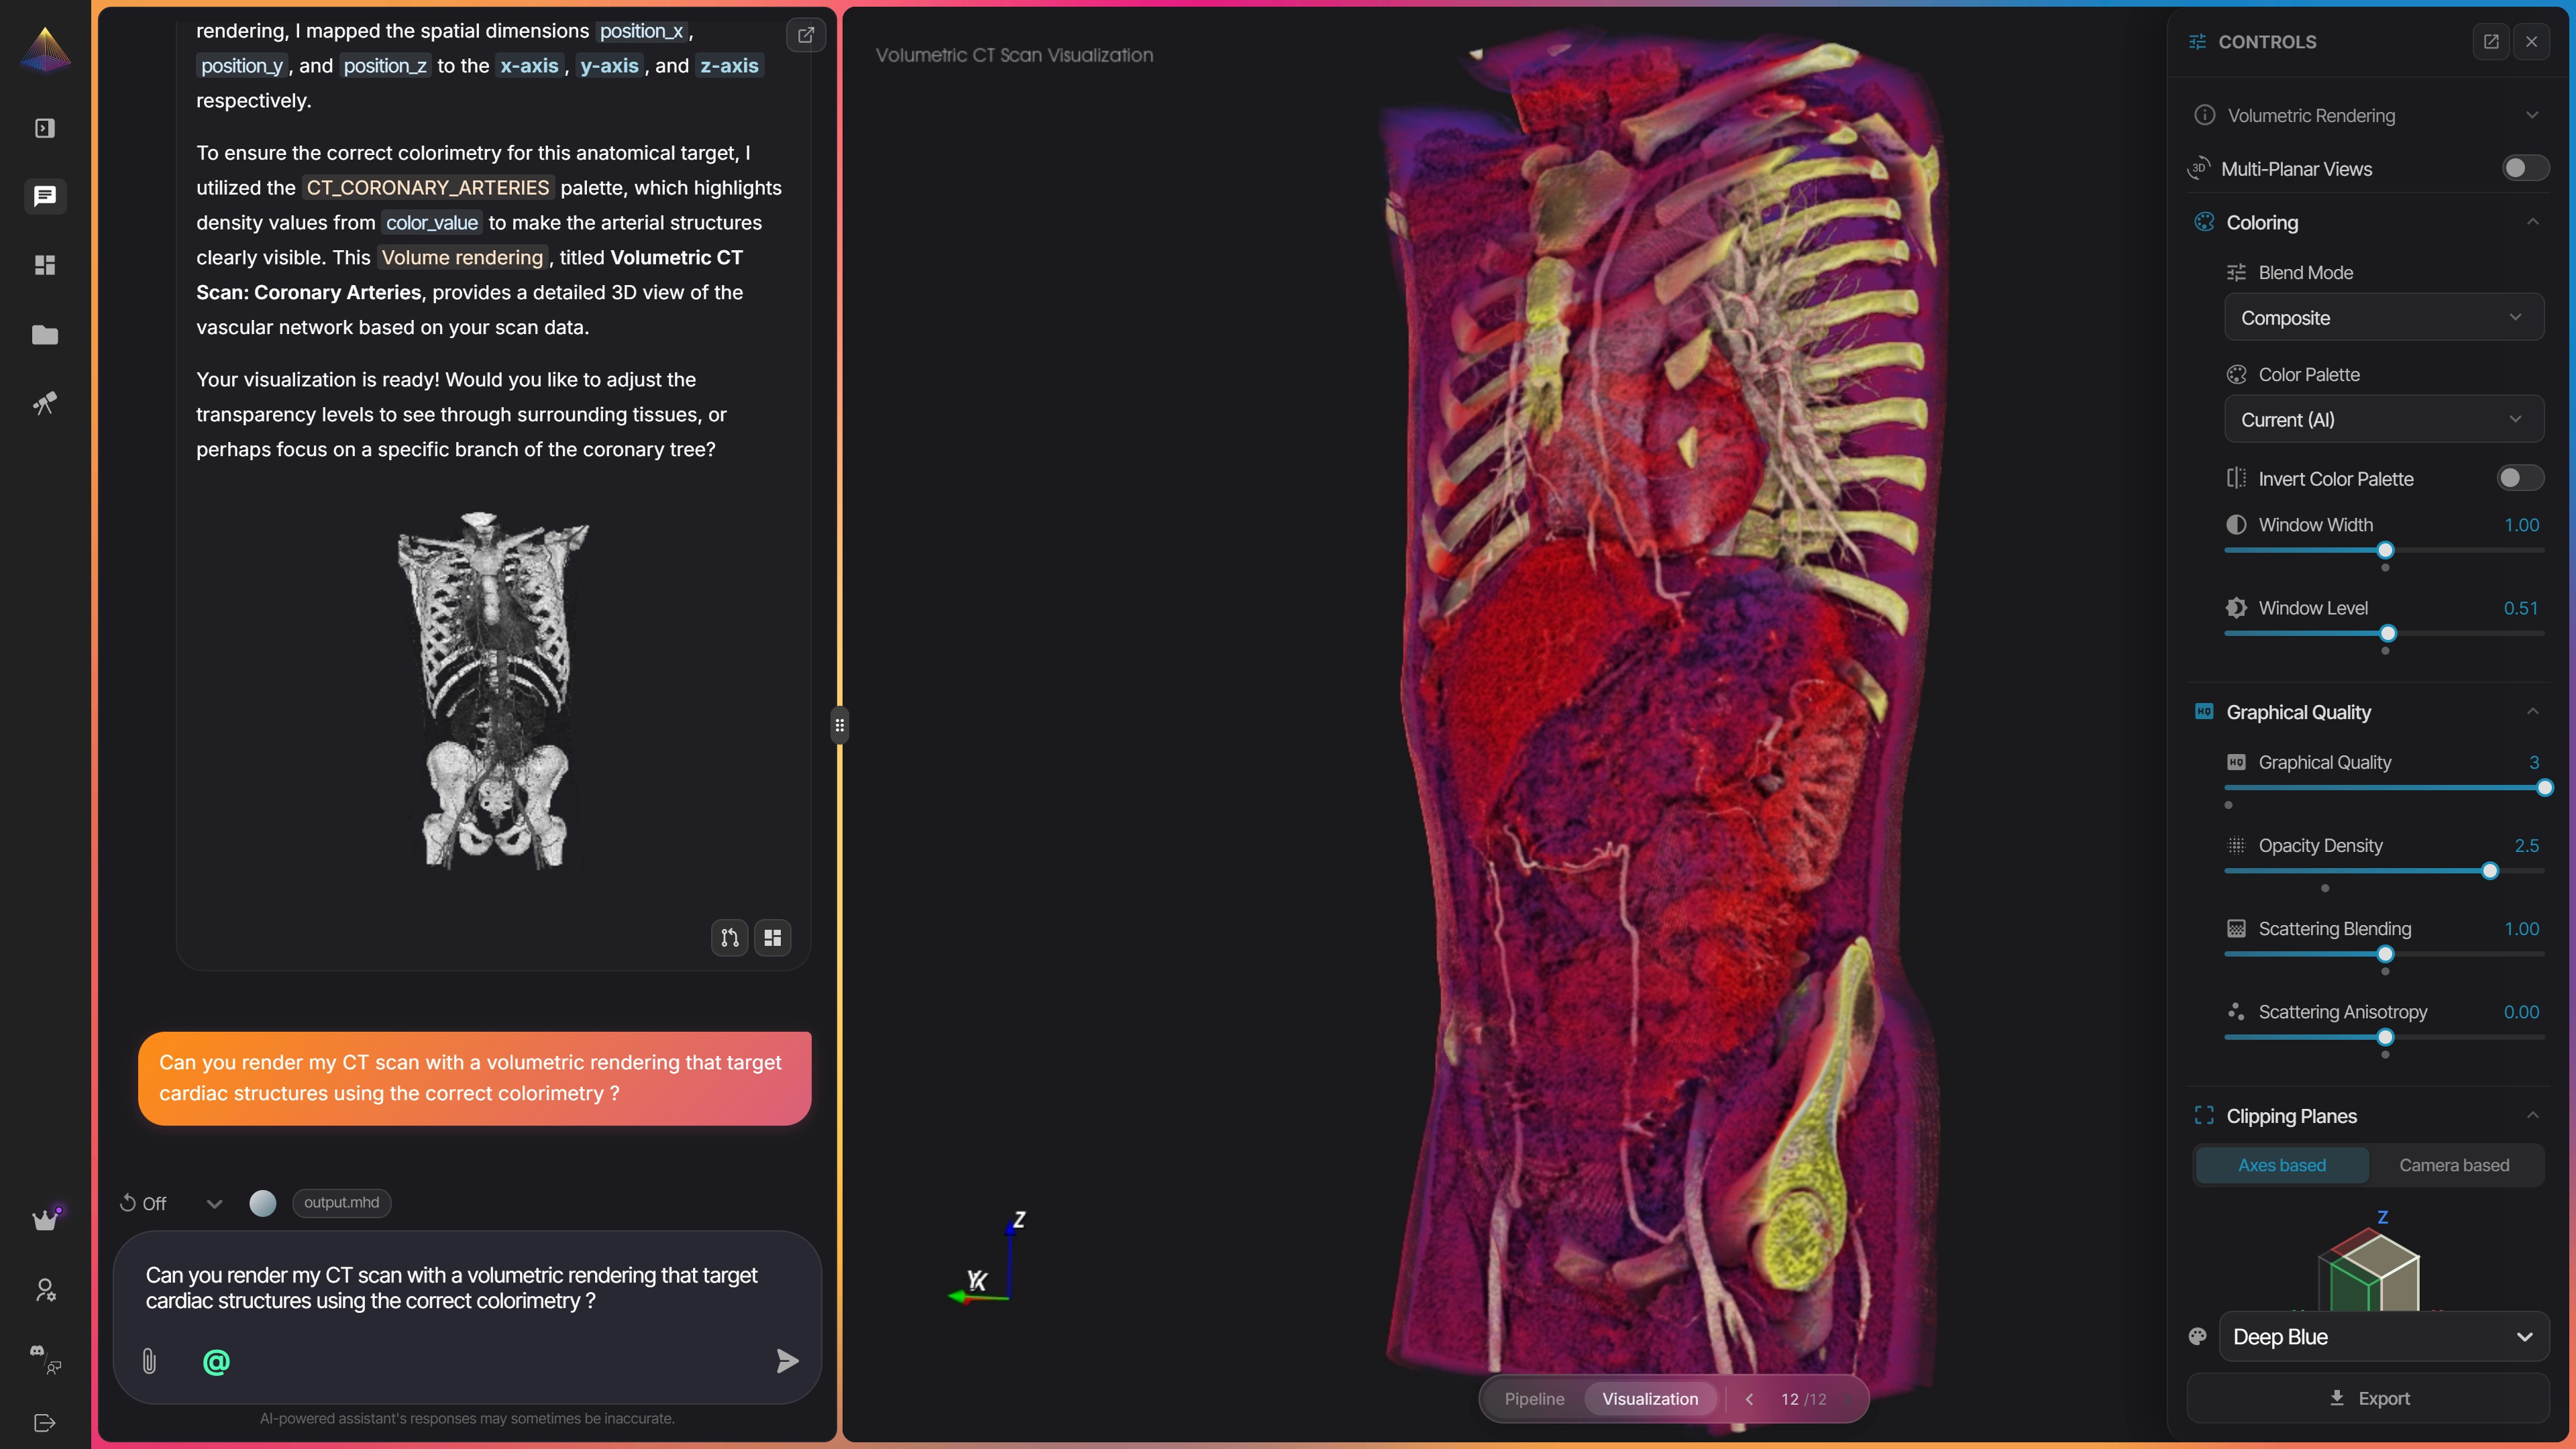
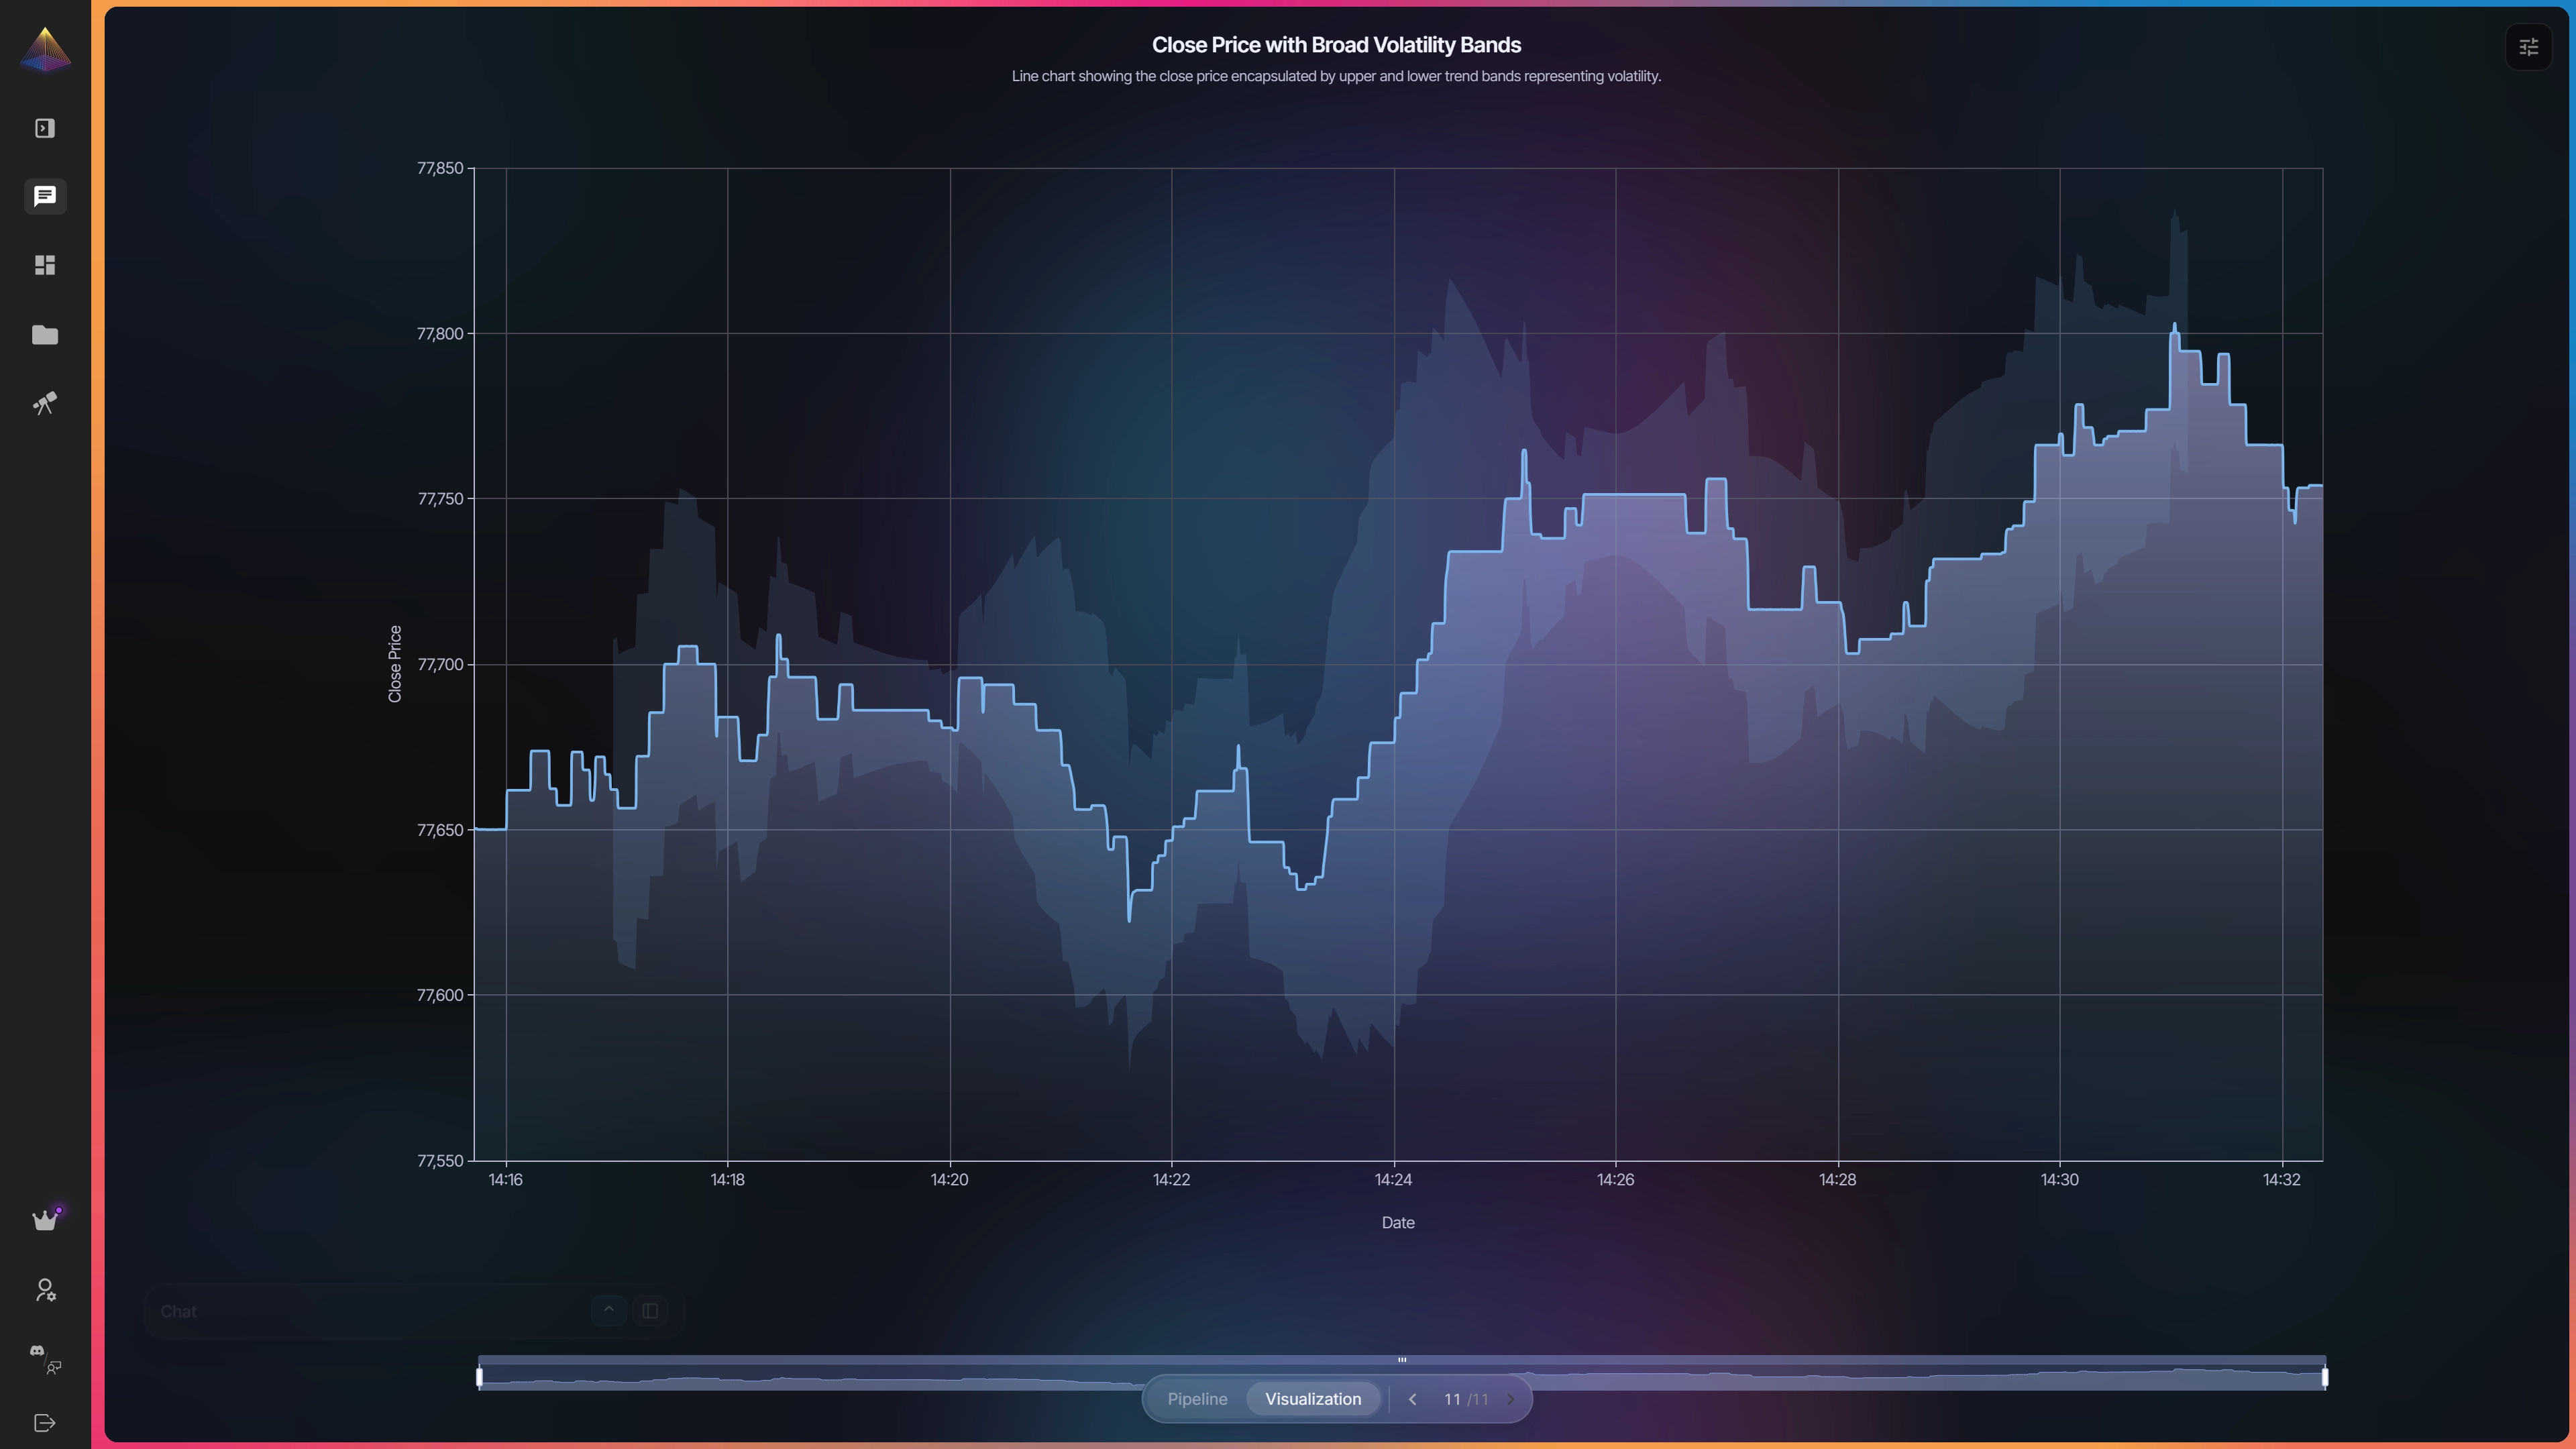
Spreadsheets, clinical data, time series, images — Nveil ingests, cleans and combines automatically.

Drop your files here or browse
CSVTSVXLSXXLSODSJSONPARQUETDICOMMHDEDFPNGJPGTIFFBMPWEBPGIFMATXML
XLS
clinical_trial_results.xlsx
XLS
clinical_trial_results.xlsx
4.2 MB · 12,847 rows
Your files are never used for AI training or any other purpose beyond generating your visualizations.
02

Describe what you need

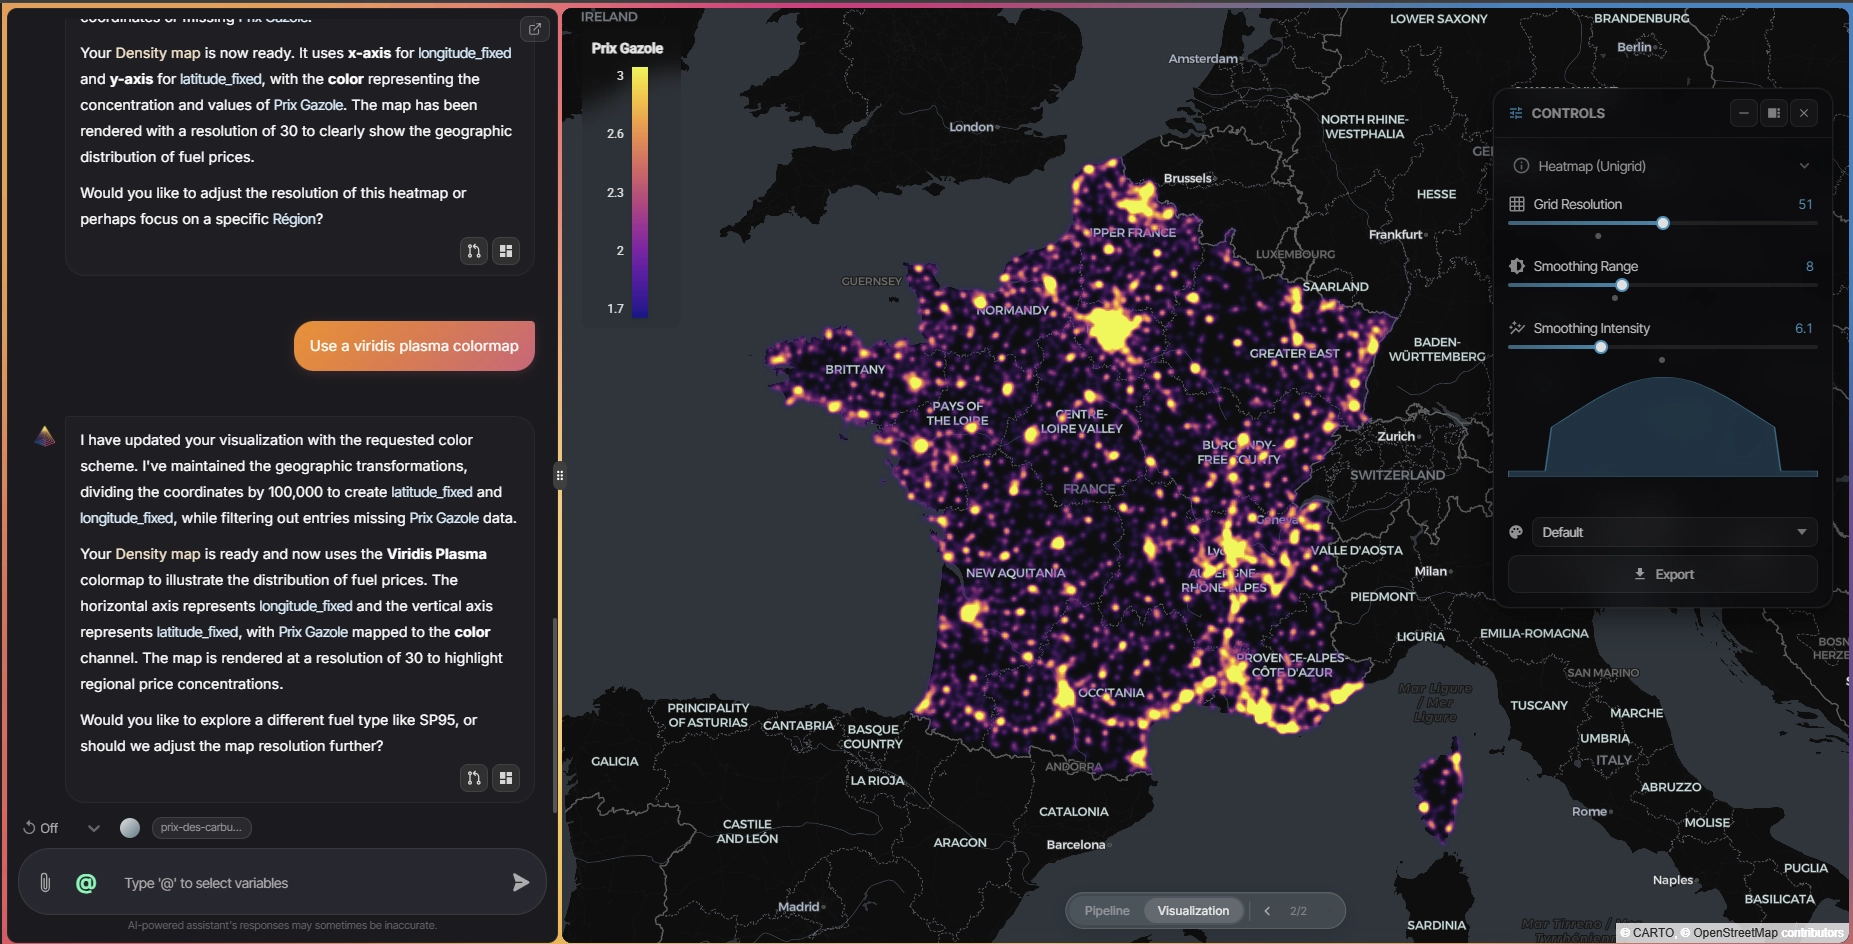
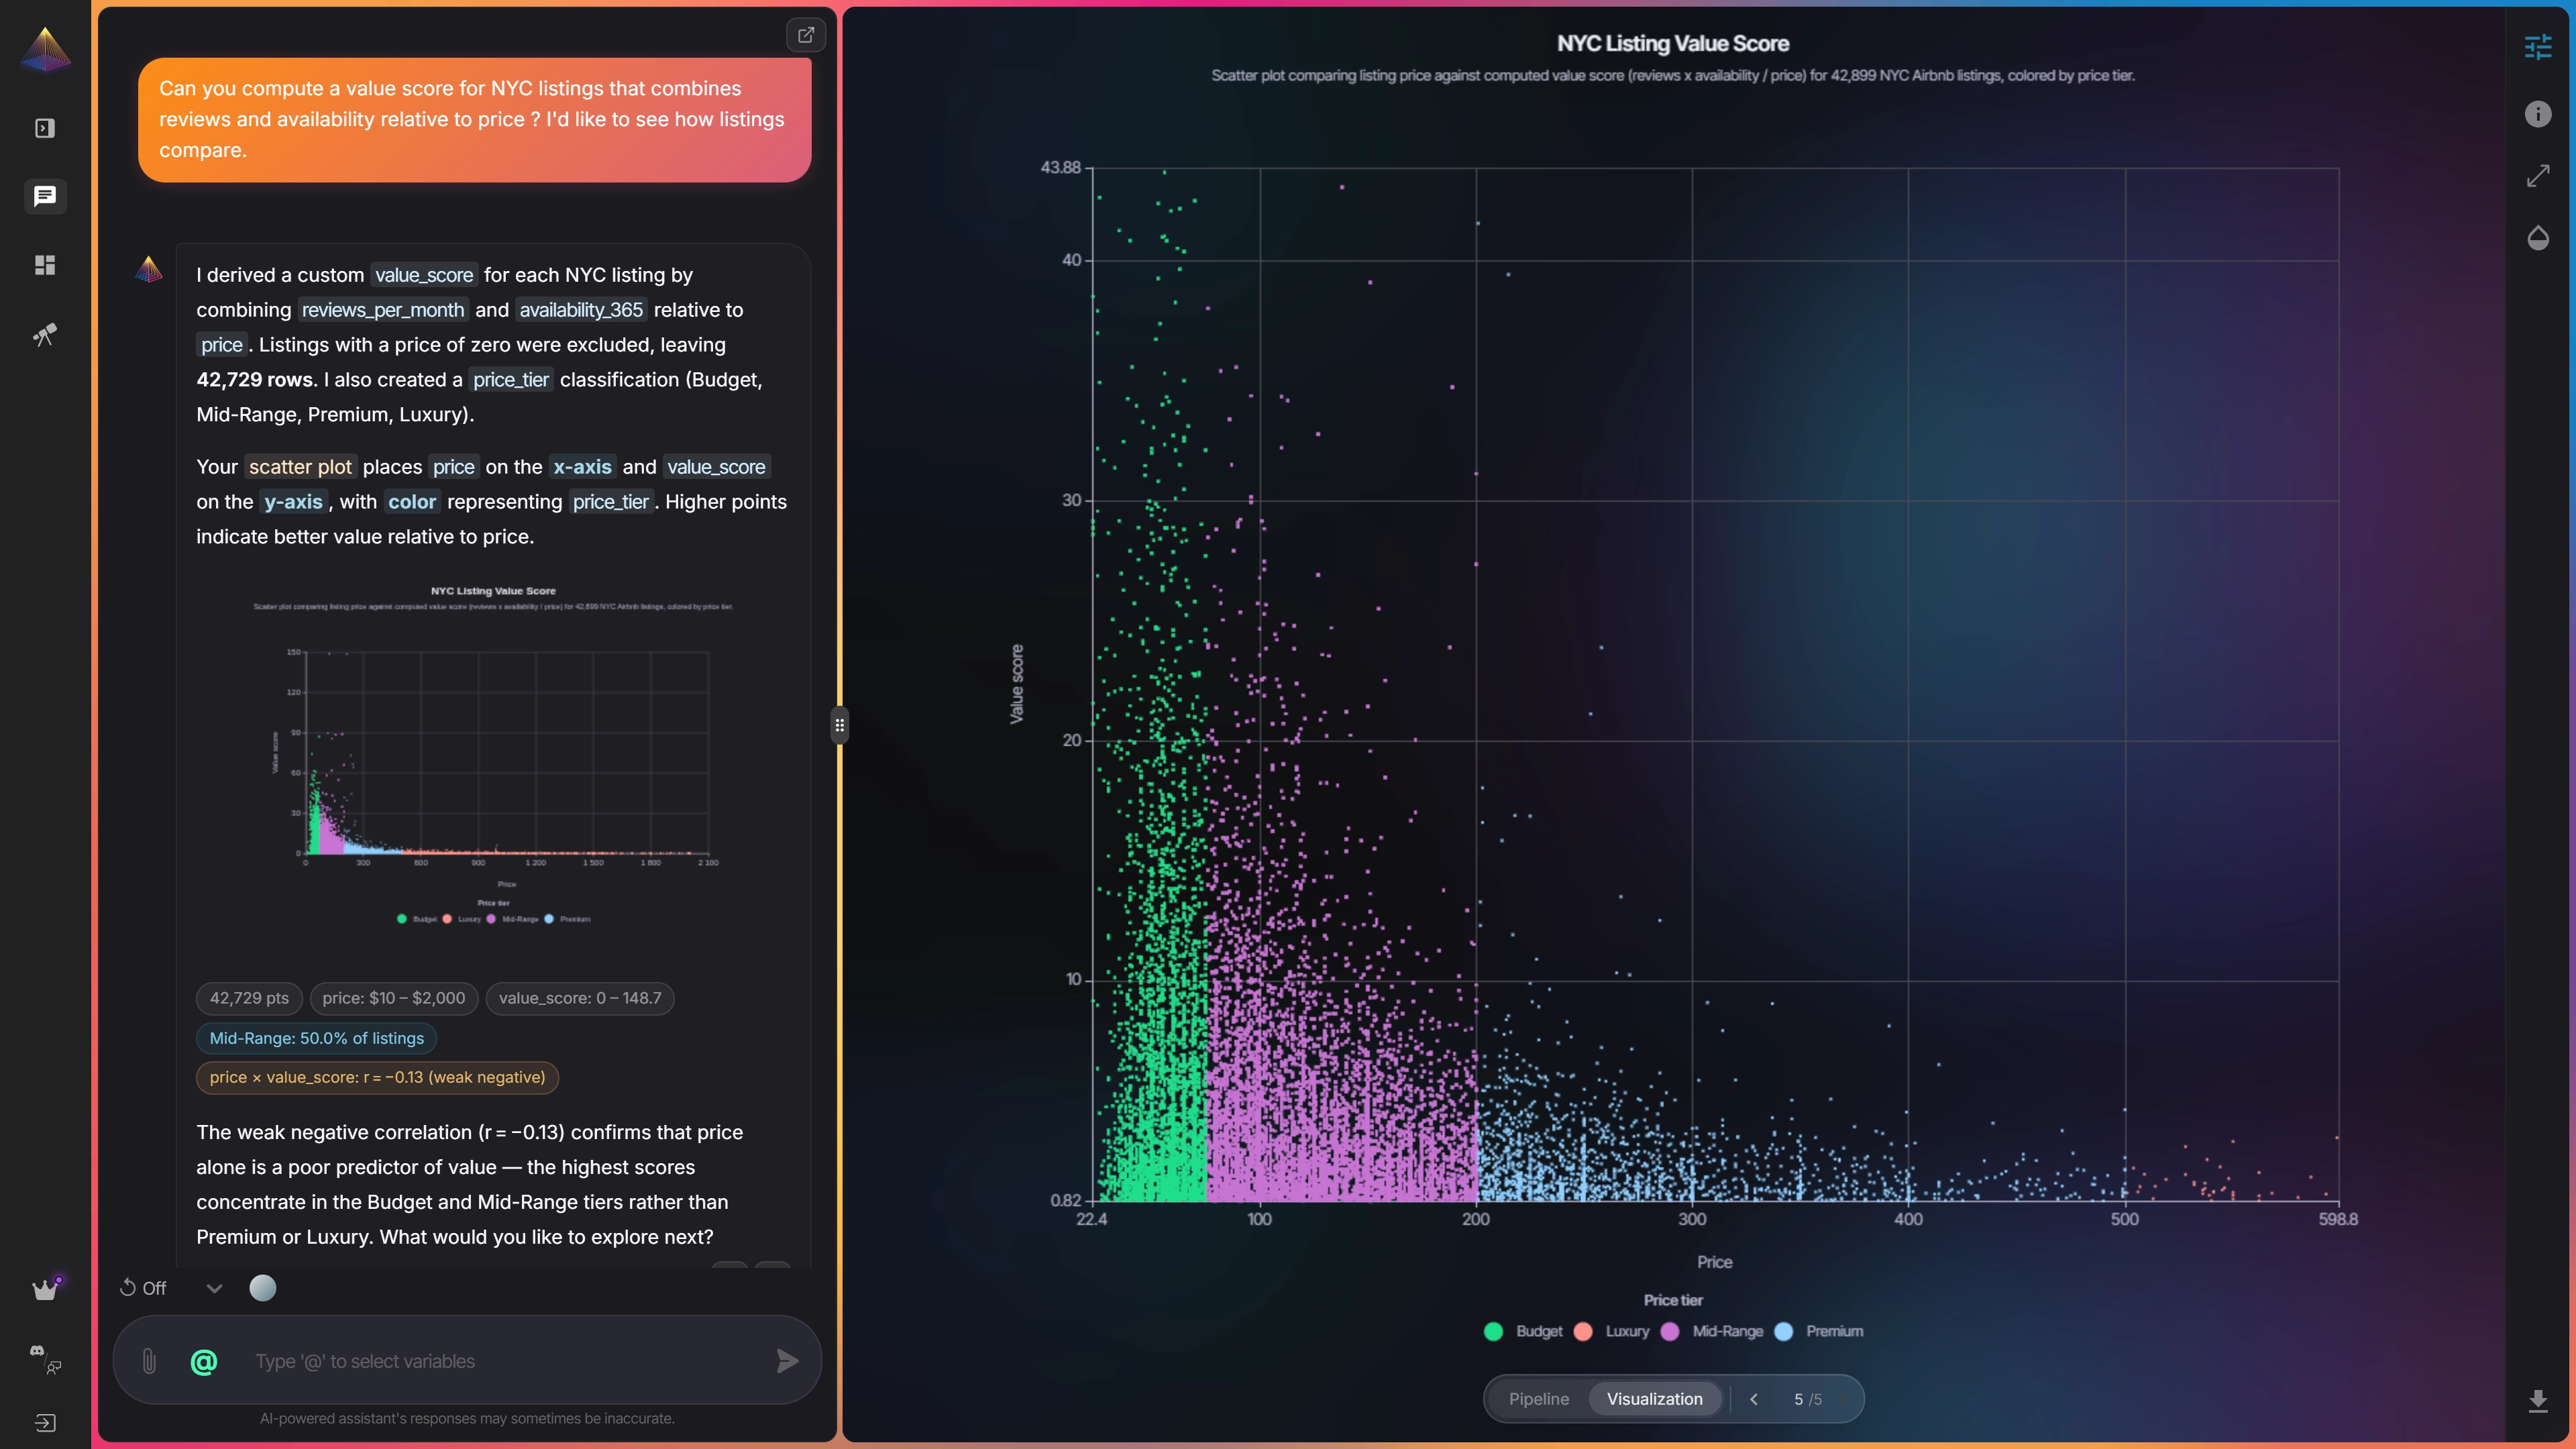
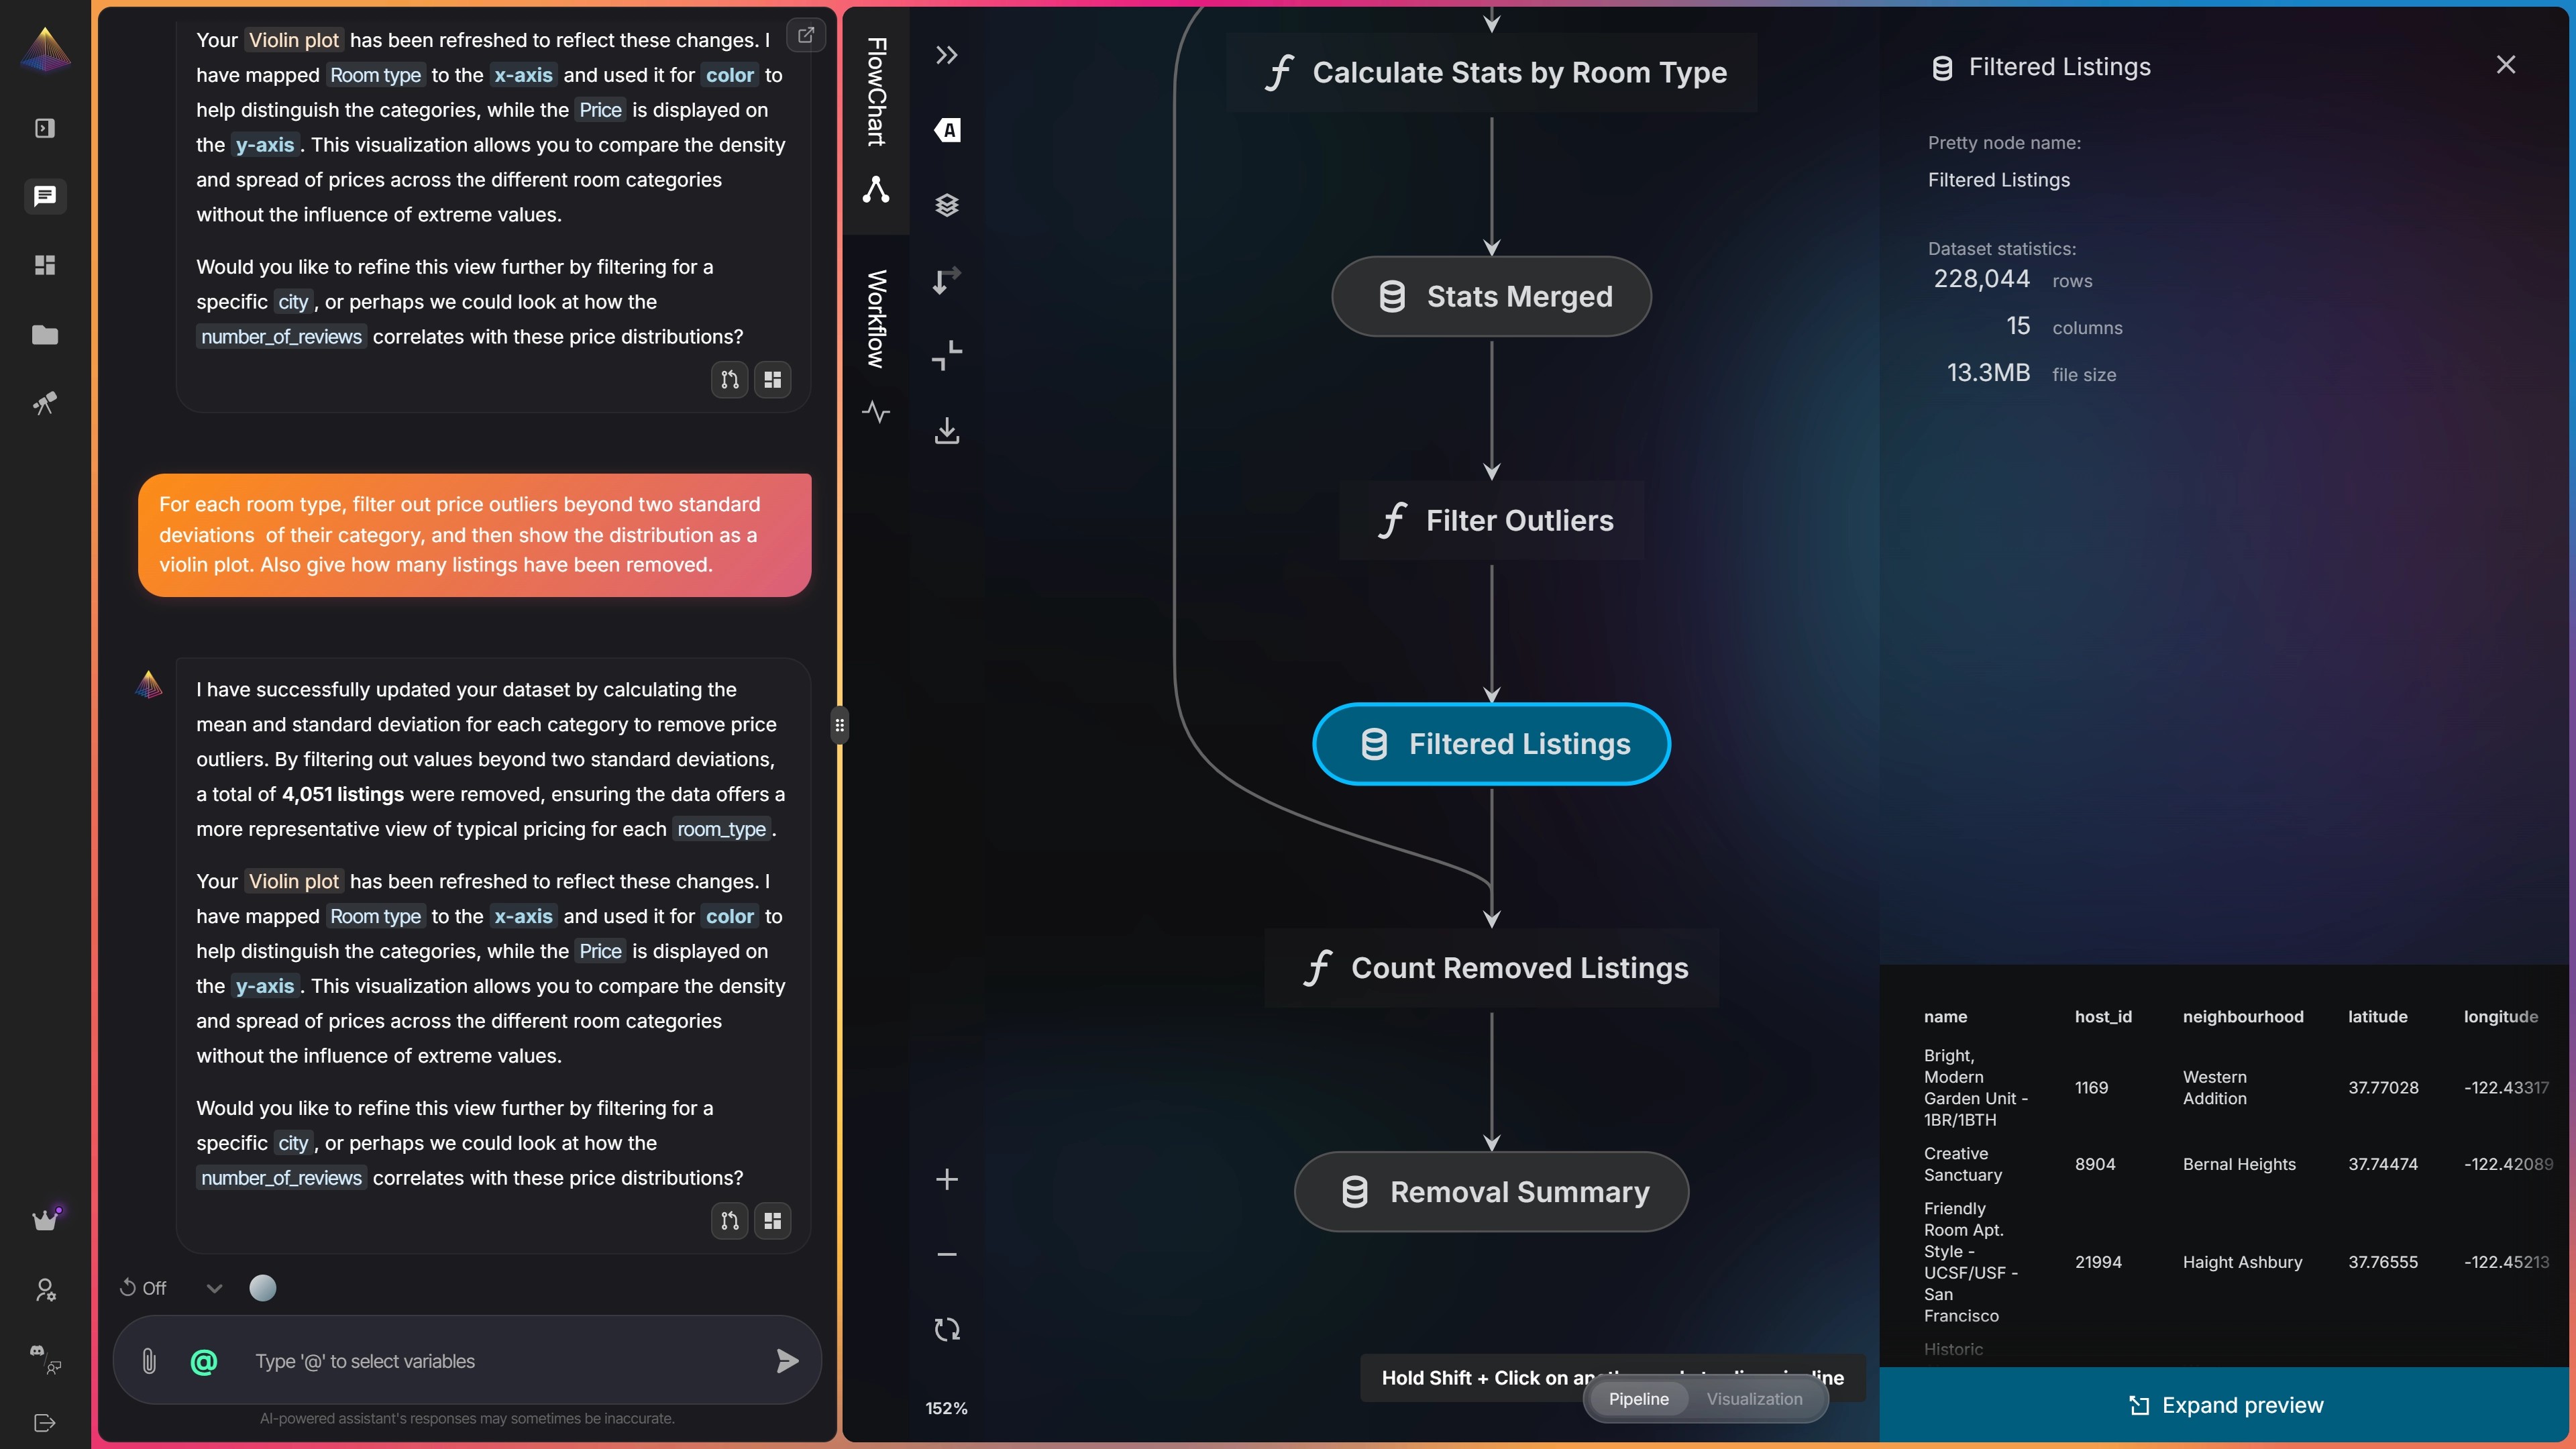
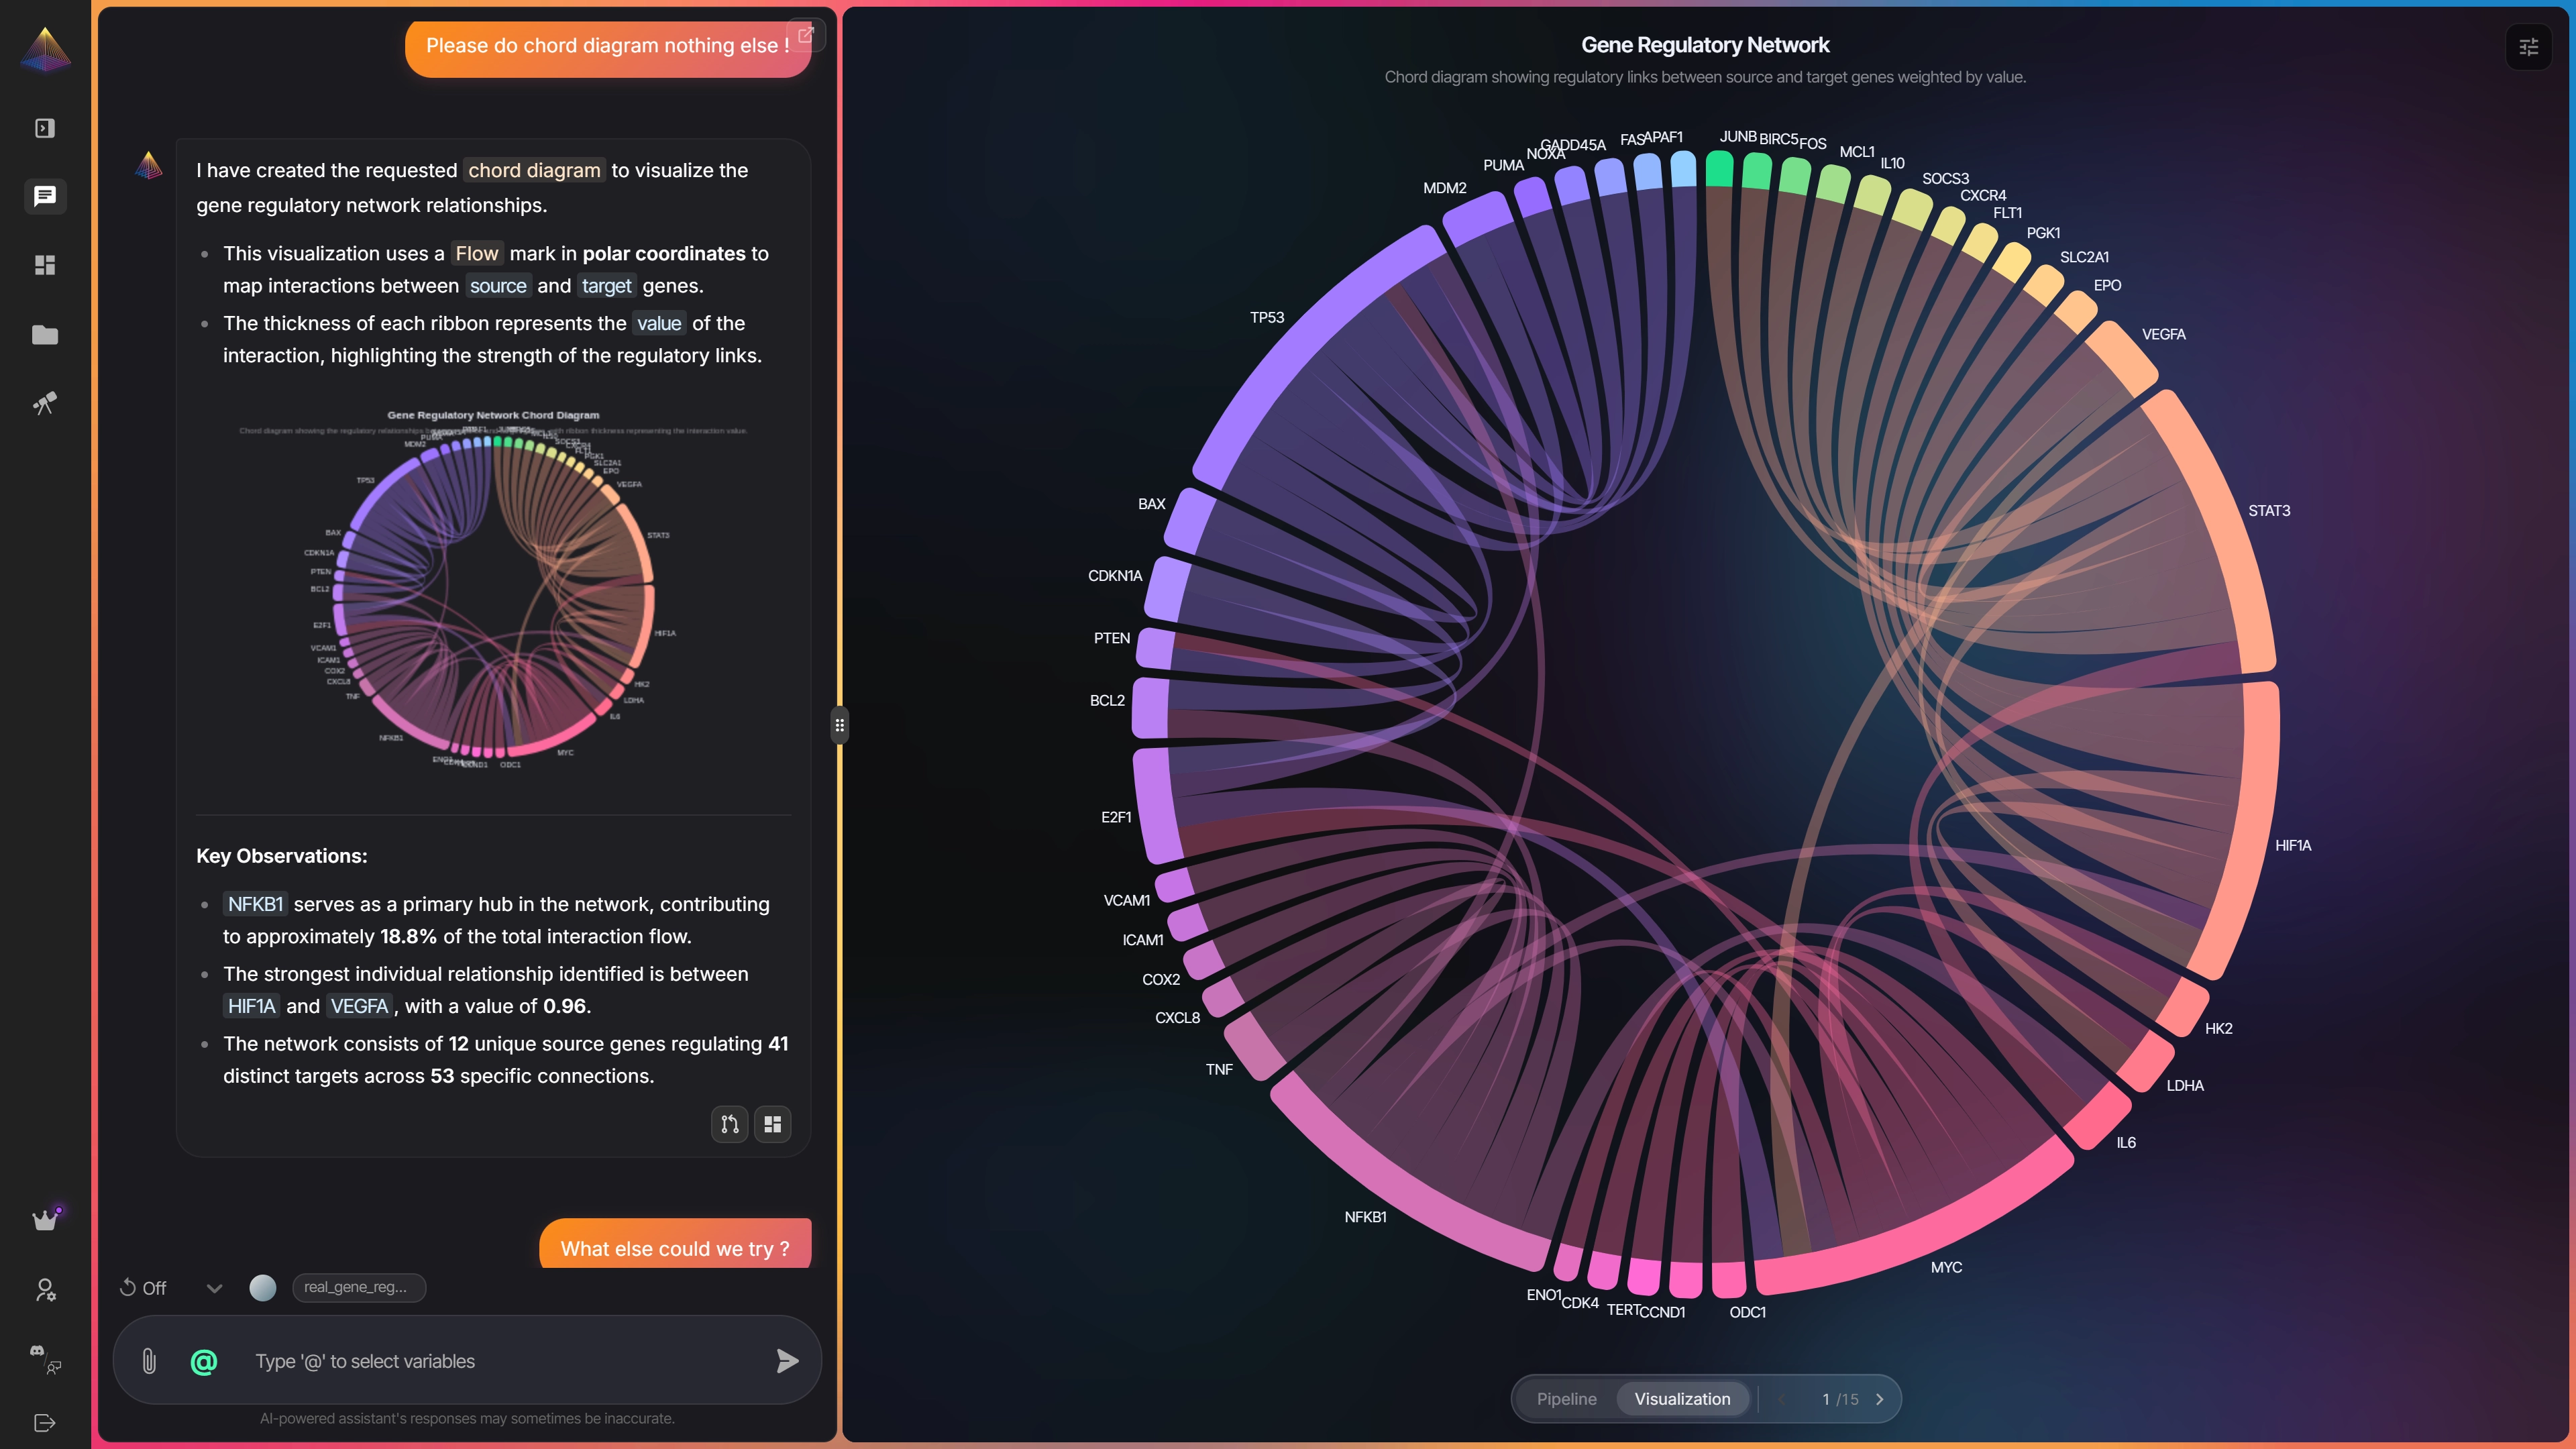
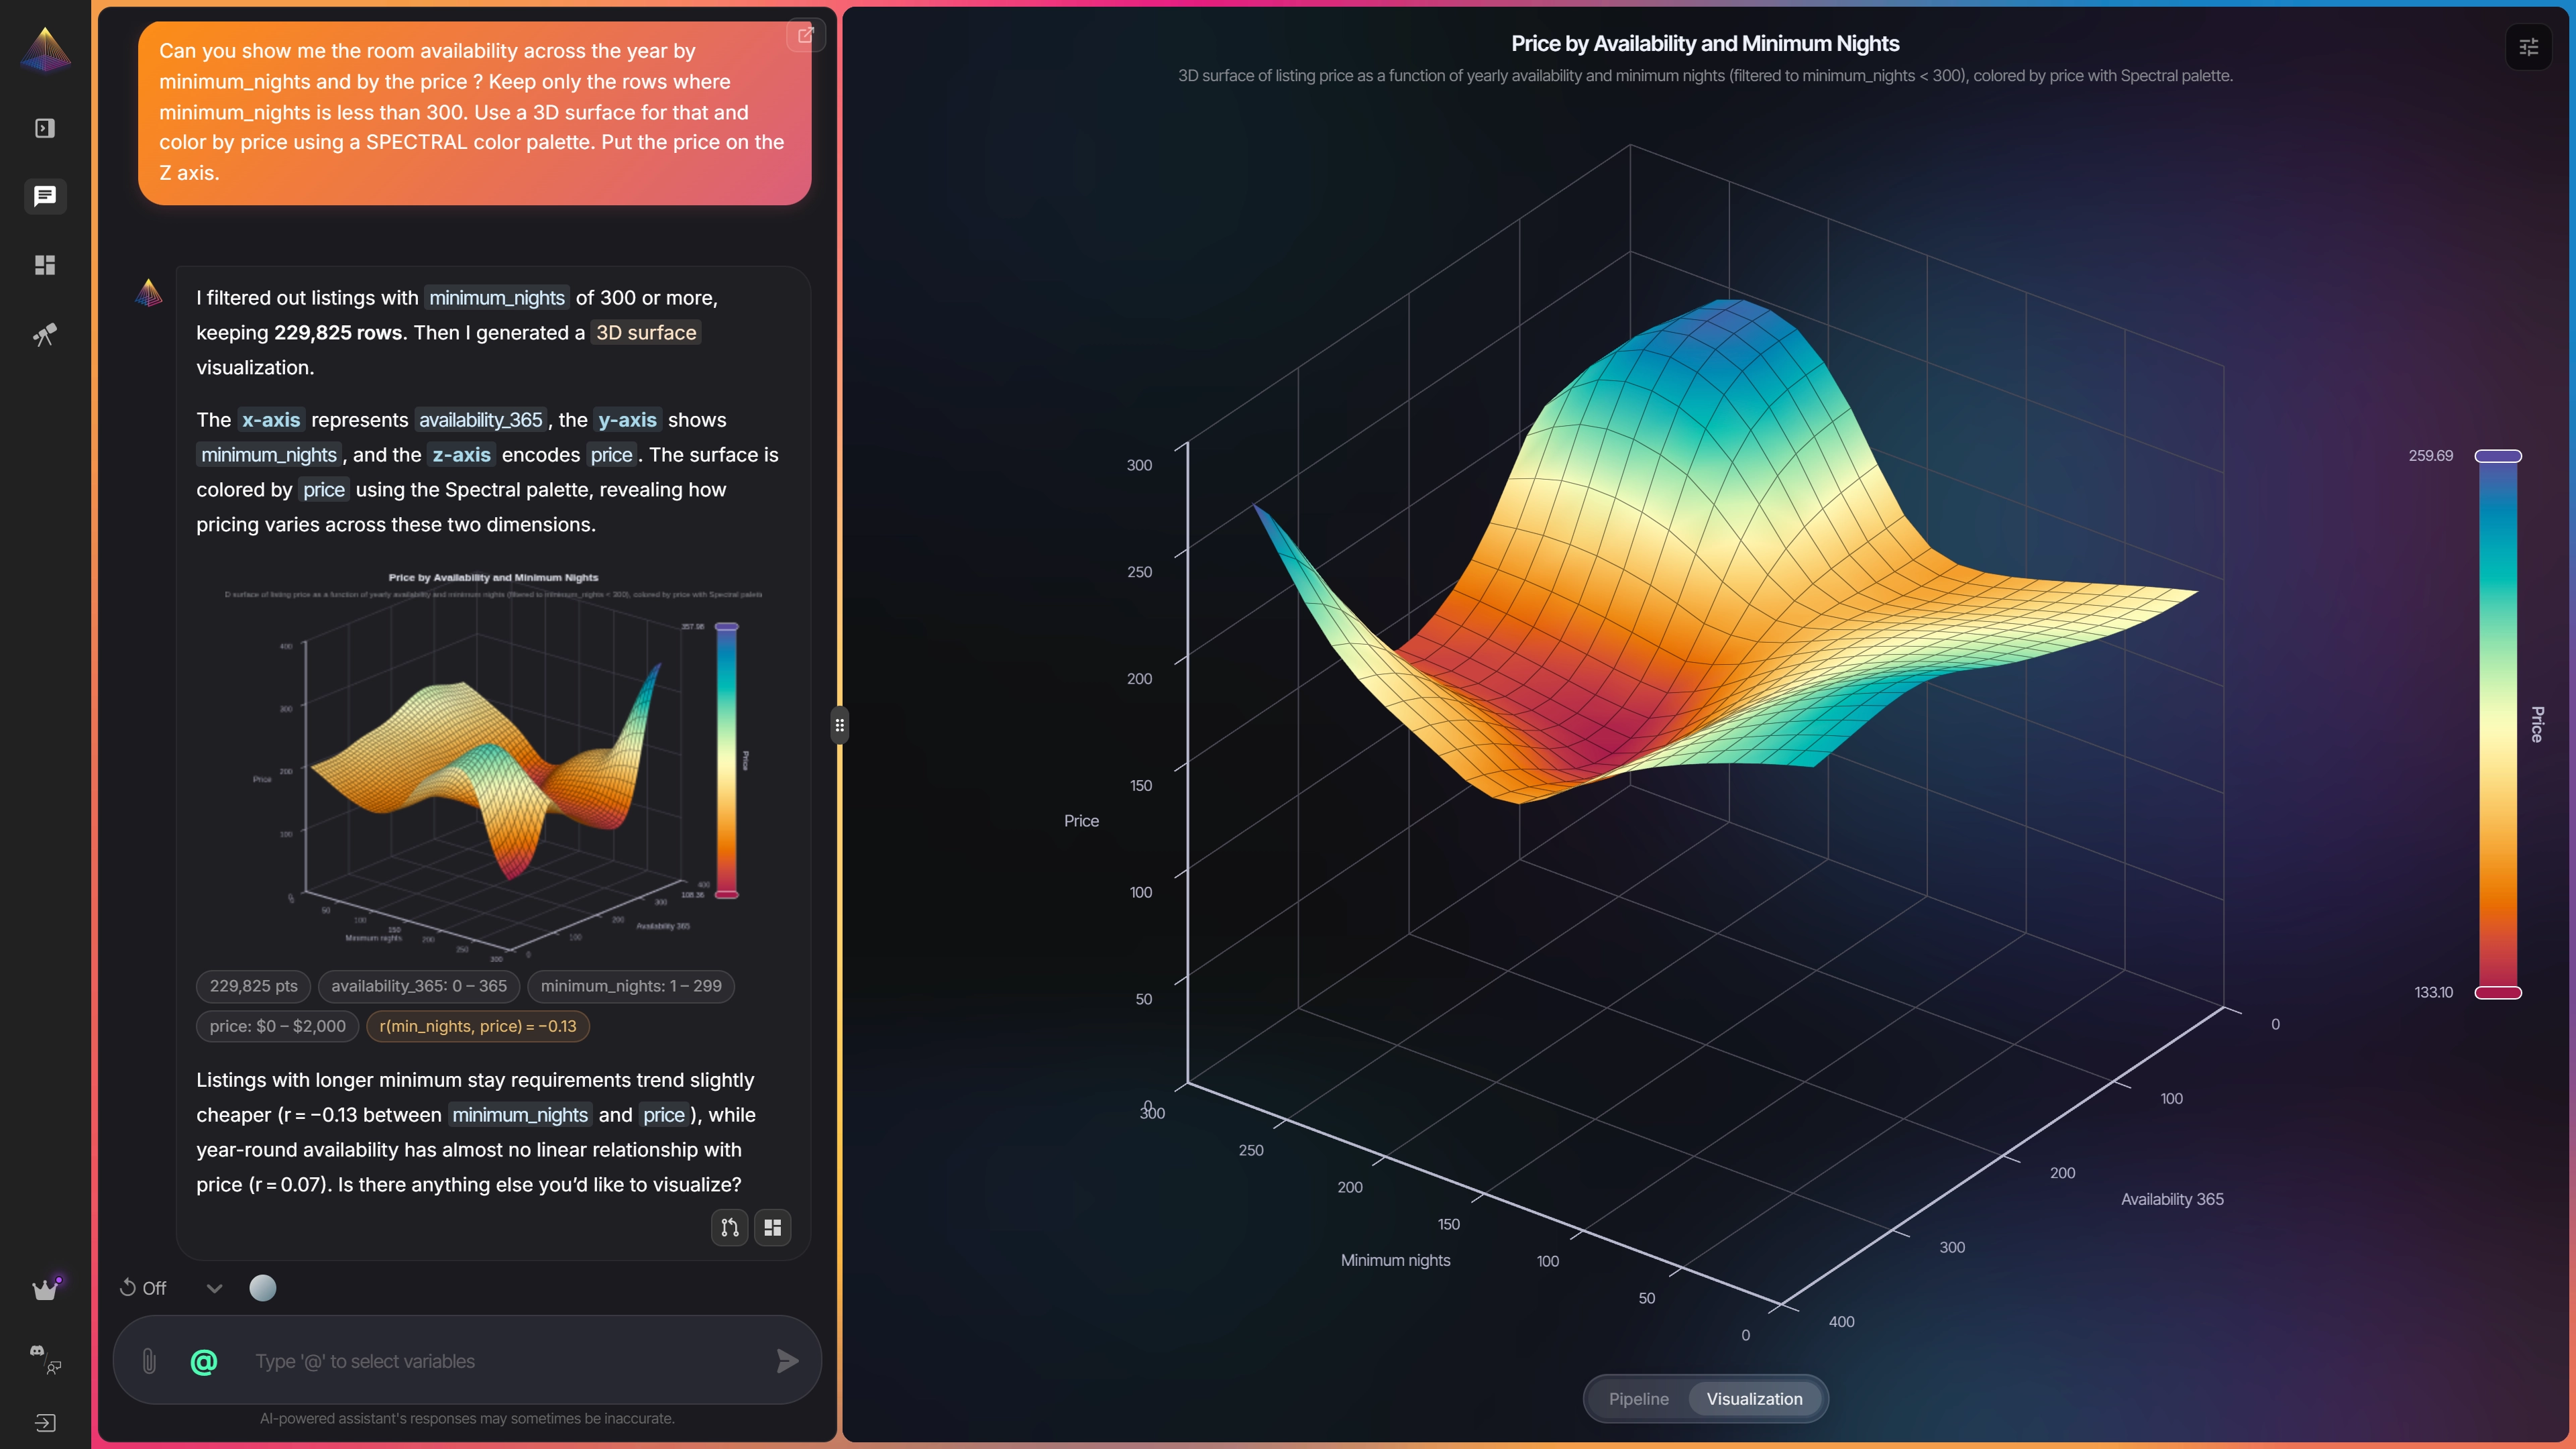
Chat in plain language — Nveil understands your intent and translates it into deterministic pipelines.

Analyze the distribution of patient recovery times across treatment groups
Ask anything about your data...
03

Nveil builds it

A deterministic pipeline processes your data step by step — reproducible, traceable, trustworthy.

Analyze the distribution of patient recovery times across treatment groups
Nveil
Here's your box plot comparing recovery_time across the 4 treatment groups (n=1,225 patients).

Treatment B stands out with the fastest median recovery (11.8 days) and the tightest IQR (9.2–15.4), suggesting more consistent outcomes. Placebo is notably slower at 22.1 days with wider variability — two outliers above 30 days may warrant clinical review.

A Kruskal-Wallis test confirms a highly significant difference between groups (H = 47.3, p < 0.001). You might consider a post-hoc Dunn test to identify which specific pairs differ.
Ask anything about your data...
trial_data Parse & Clean Group & Filter Statistics Build Viz summary
Recovery Time by Treatment Group (days)
Days 35 28 21 14 7 Treatment A Treatment B Treatment C Placebo
Treatment A (n=312) Treatment B (n=298) Treatment C (n=305) Placebo (n=310)
Pipeline Visualization

Powered by Choregraph™, our deterministic engine. Built for science. Useful everywhere. How it works

Why data work eats your week.
Three reasons turning data into a chart still hurts — and what we fixed.
  • Charts shouldn't take all afternoon: You shouldn't need Python, R, or three Excel plugins to see what your data is telling you. Manual chart-building eats hours that should go to the actual decision.
  • Your files don't speak the same language: CSVs, Excel sheets, JSON exports, scientific formats — combining them is a nightmare. Most tools make you clean before you can think.
  • Most AI is making it up: General-purpose AI hallucinates numbers, invents trends, drops decimals. When you're presenting to a board, briefing a customer, or publishing research, "probably right" isn't good enough.
Run NVEIL your way
Use the managed cloud and start in seconds, or self-host the open-source edition on your own infrastructure. Same engine, same deterministic results.
Managed

NVEIL Cloud

Zero setup. We host, scale and update it for you.

  • Start free, upgrade as you grow
  • No infrastructure to manage
  • Always on the latest version
  • Your data is never used for AI training

Freemium · app.nveil.com

Self-hosted

Open source

Run the full platform on your own servers — your data never leaves your walls.

  • Free and open source (AGPL-3.0)
  • Your data stays on your own servers
  • Inspect, audit and extend the code
  • Community support on Discord

AGPL-3.0 · github.com/nveil-ai/nveil

What users are saying.
Angélique StephanouResearch Director at CNRS
Angélique Stephanou

Research Director at CNRS

"Properly visualizing multimodal tumor evolution simulations is a real headache... With NVEIL AI, I extract key variables in minutes and get clear, coherent views..."
FAQ

What file types can I import (CSV, JSON, DICOM, etc.)?

Currently, NVEIL AI supports TXT, CSV, XSLX, XML, JSON, DICOM, MHD files. We are working every day to add new extensions and will offer conversion solutions for other formats in the future.


Does NVEIL AI require coding or data science skills?

NVEIL AI was designed to be used by everyone, without requiring coding or data science skills. Its intuitive interface allows everyone to leverage the power of AI without needing advanced technical knowledge.


What is the difference between NVEIL AI and a classic data-viz tool?

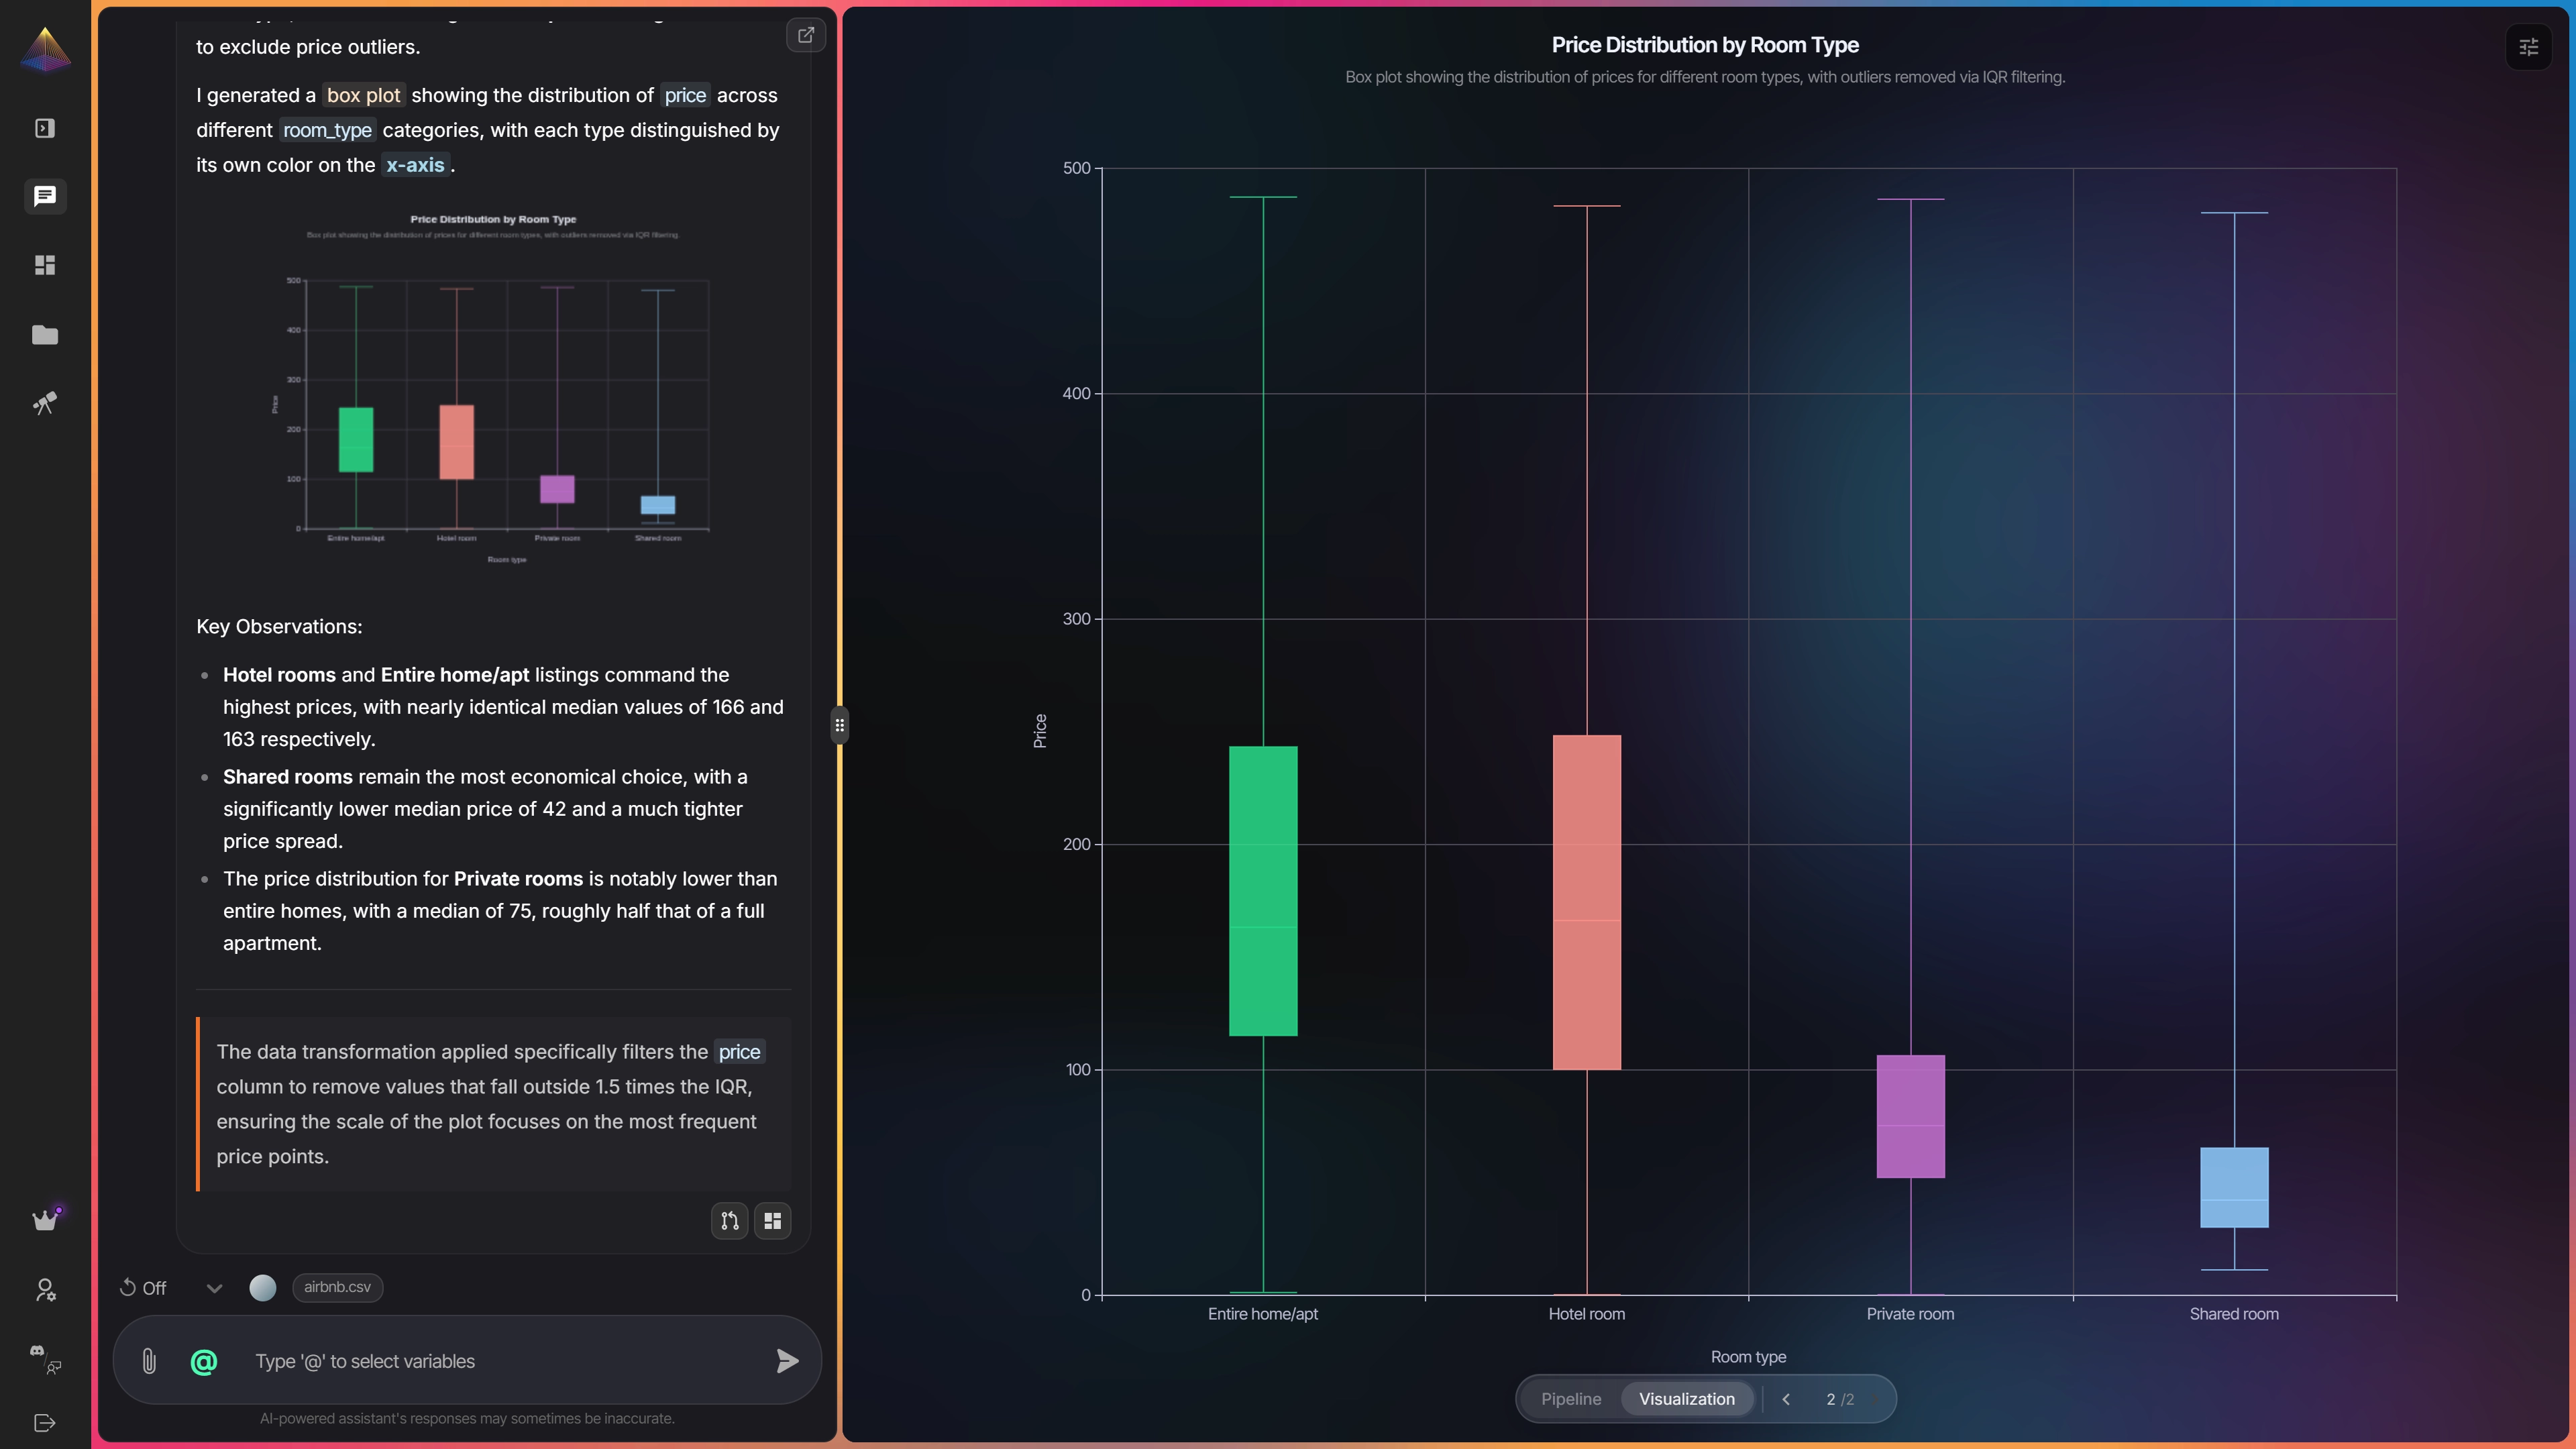
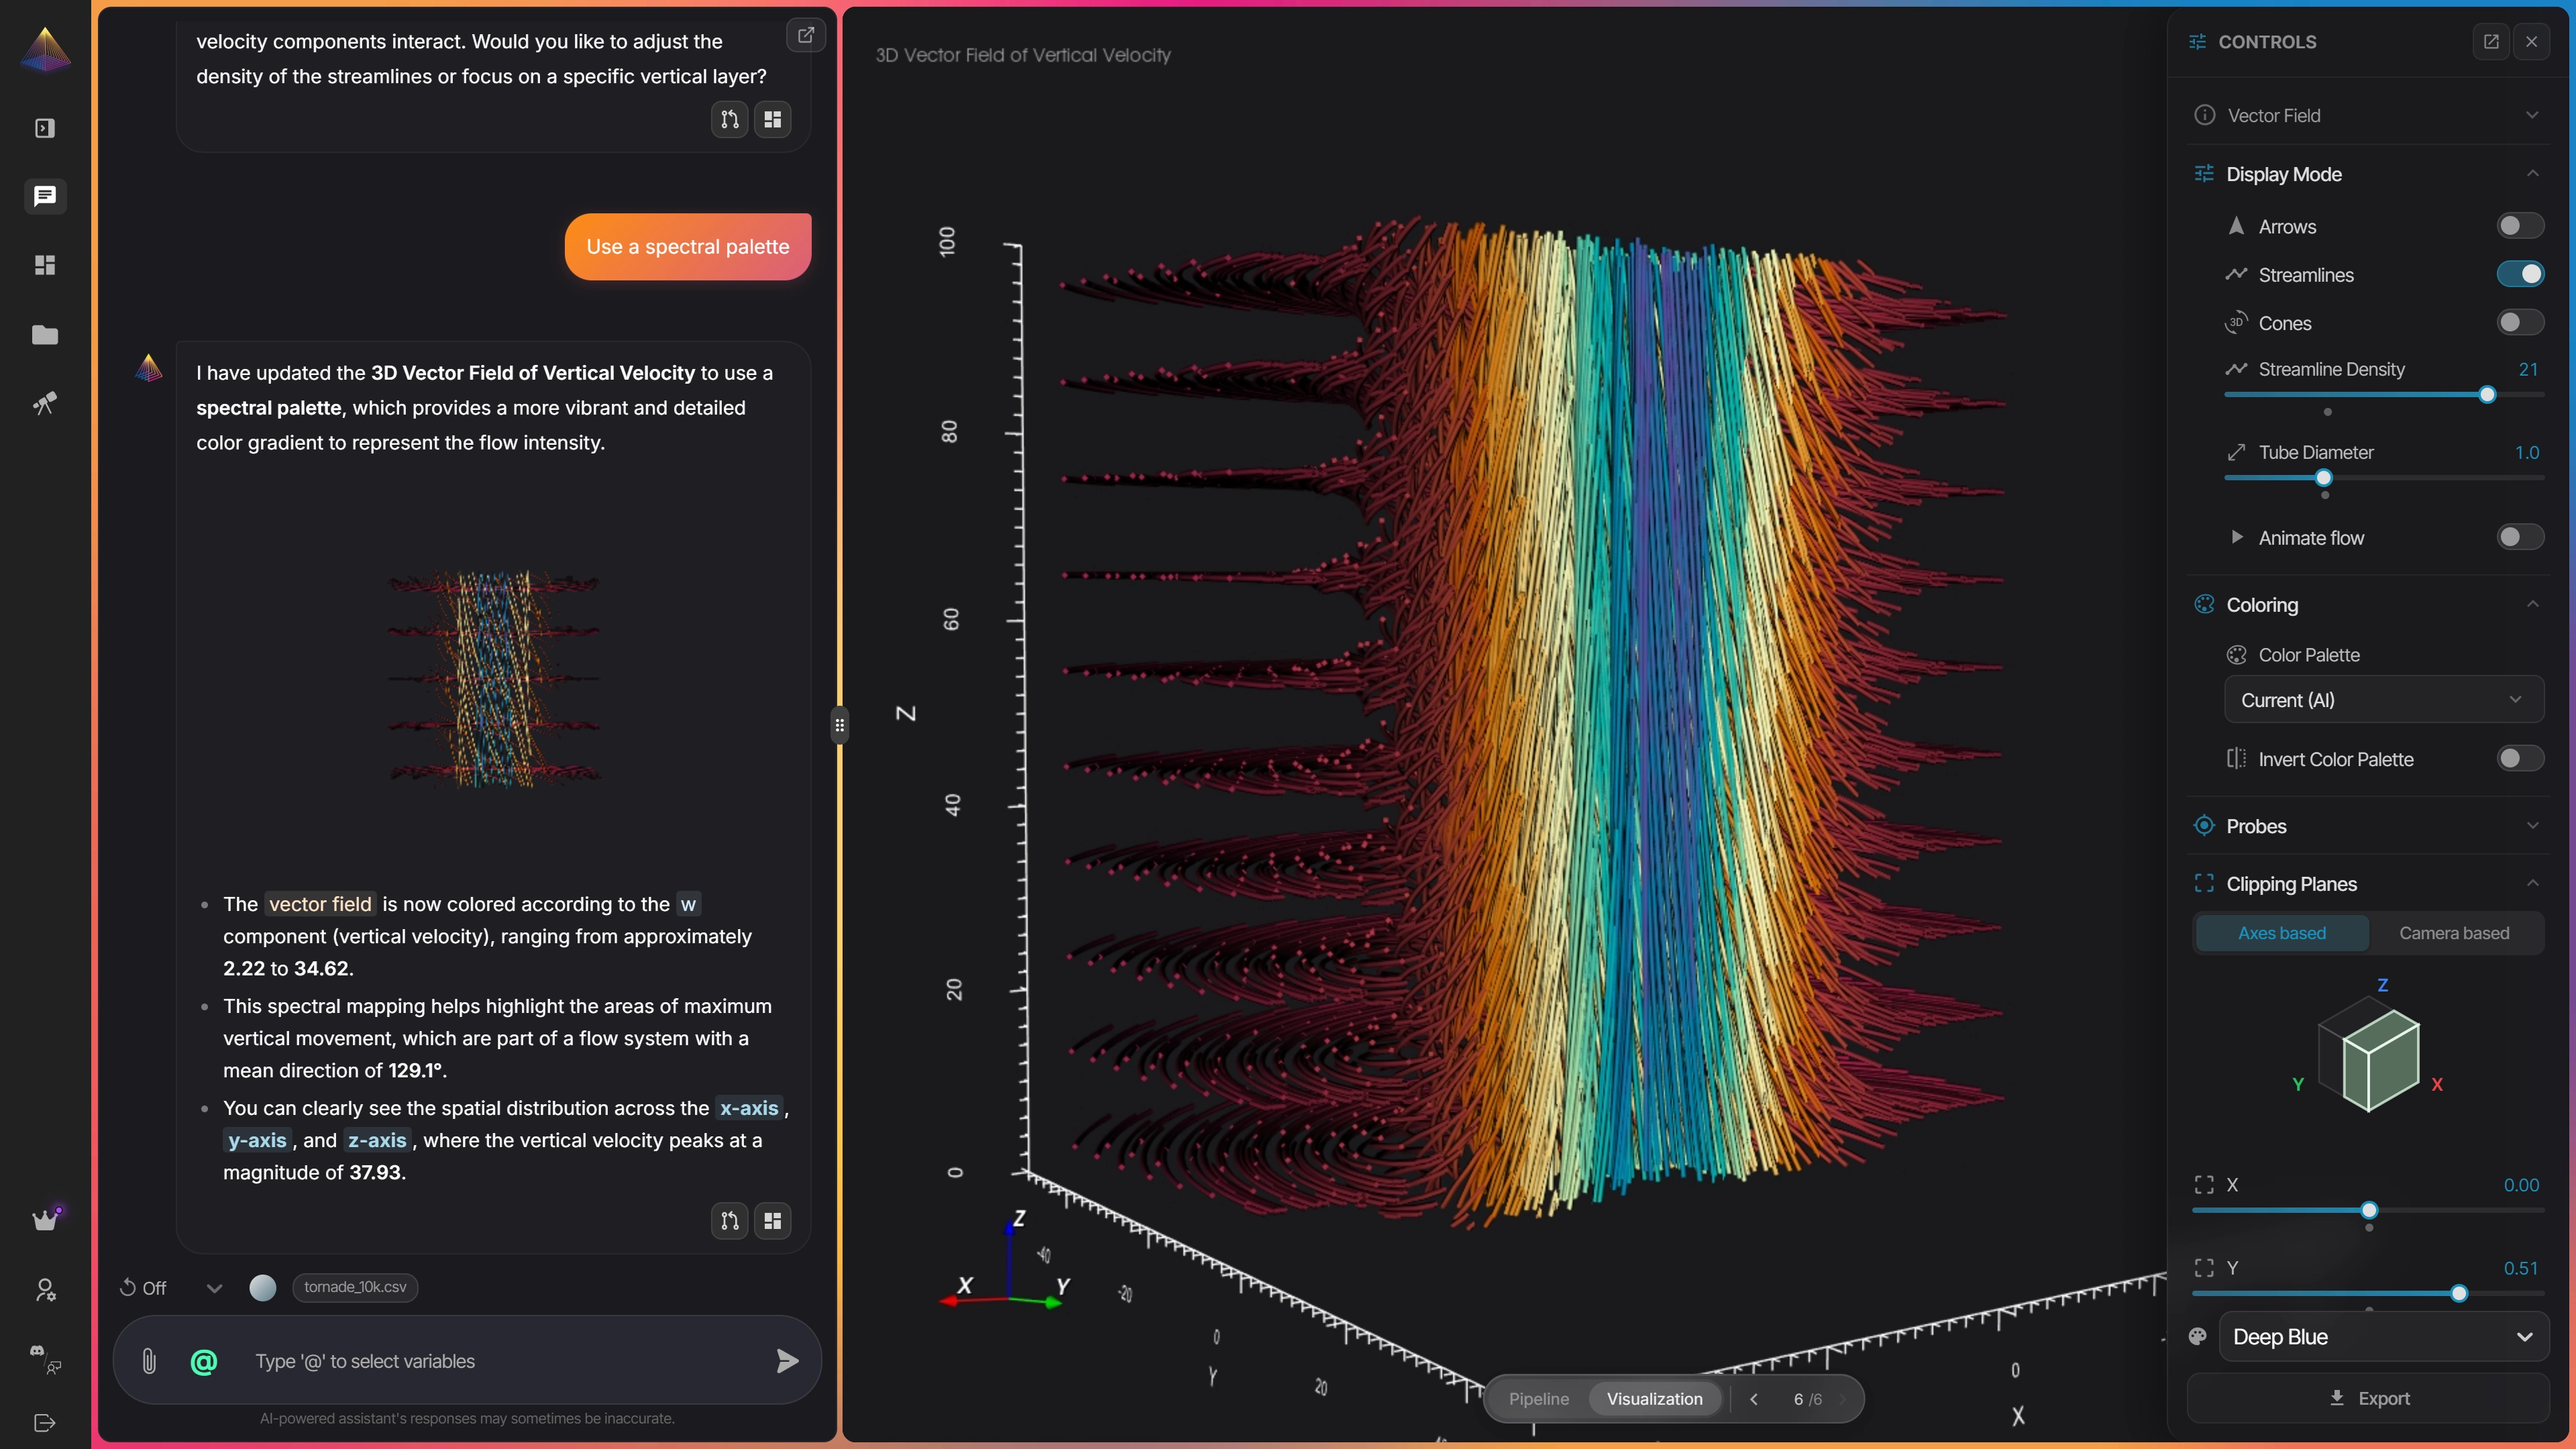
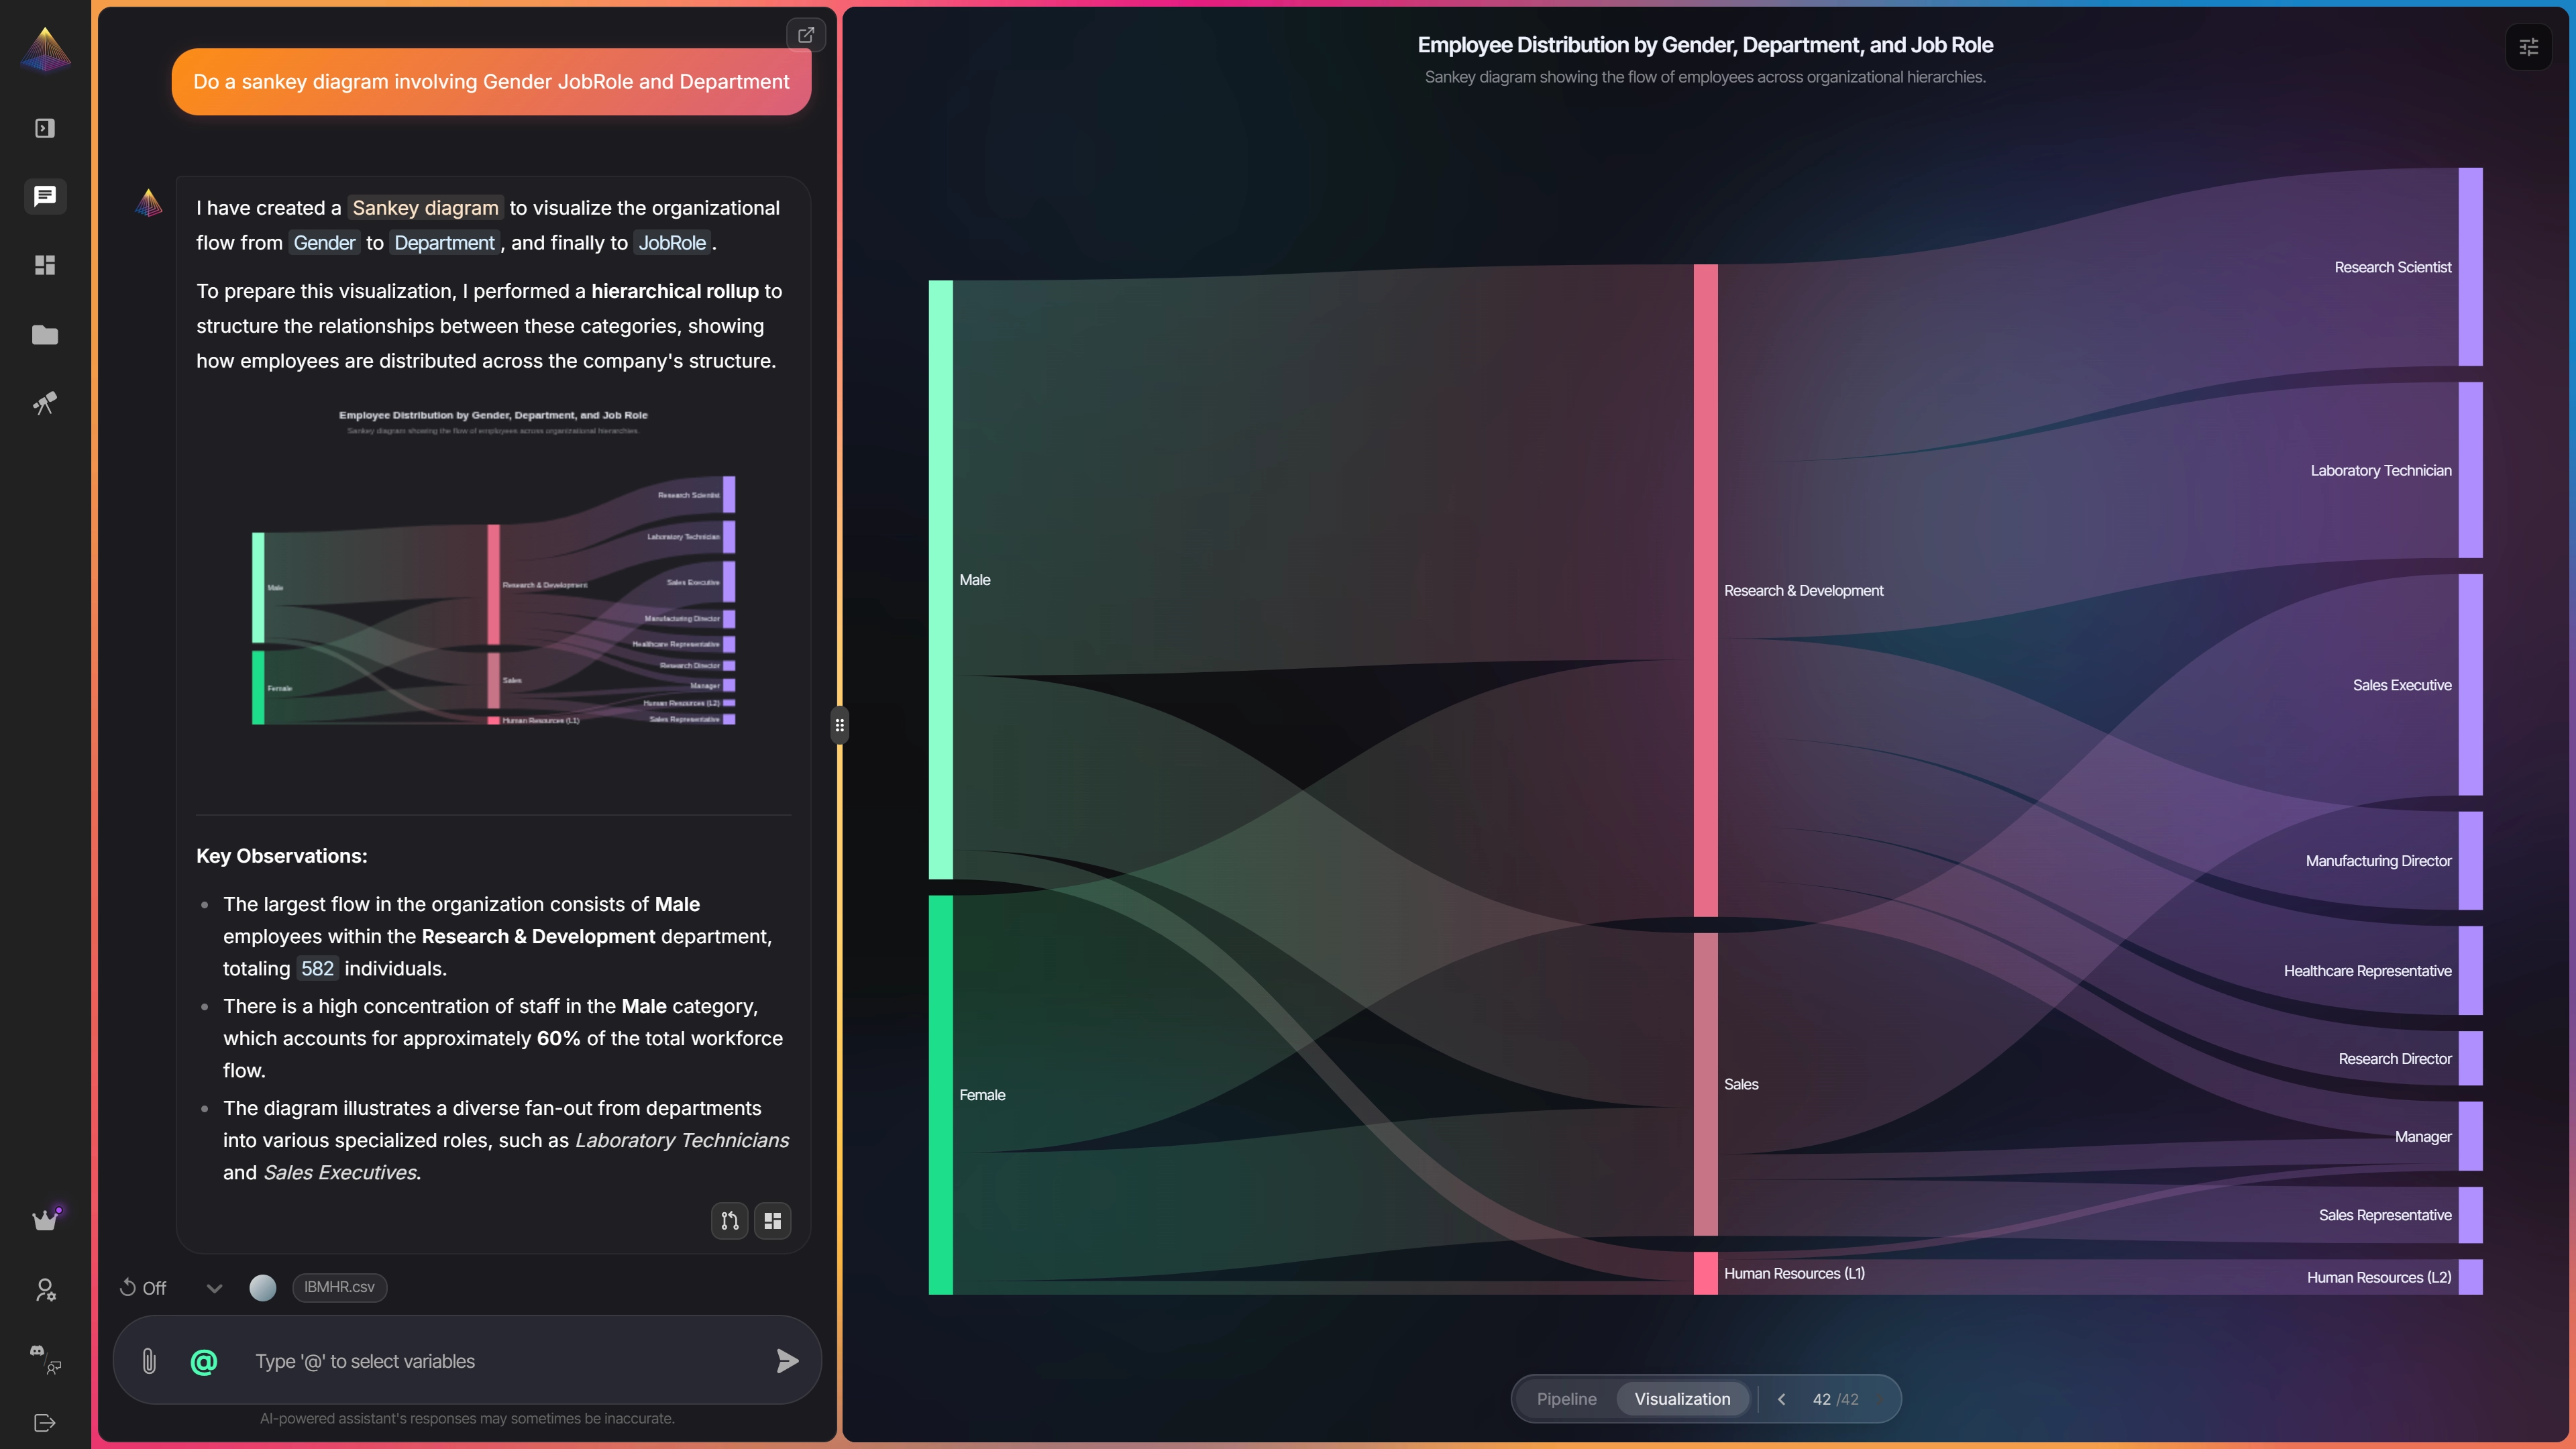
NVEIL AI stands out from classic data-viz tools by its ability to automate the process of creating visualizations from raw data.


Can the tool handle very large files (several GB)?

NVEIL AI was designed to handle large volumes of data, including files of several GB. To access large volume data processing, however, you must subscribe to a suitable offer.


Can I export my visualizations to other tools?

NVEIL AI allows you to export your visualizations to several common formats (images, PDF files, HTML) facilitating their integration into other tools.


Does the AI explain its choices? How does explainability work?

Yes, NVEIL AI provides explanations for its choices and recommendations. Explainability is integrated into the process.


Does NVEIL AI work online or can it be installed locally?

Both. NVEIL Cloud (app.nveil.com) runs online with nothing to install. You can also self-host the open-source edition on your own servers — it's available on GitHub under the AGPL-3.0 license.


What are the average processing times for a visualization?

In general, NVEIL AI aims to provide results in seconds to minutes, but this may vary depending on the size and nature of the data.


Is NVEIL open source?

Yes. The self-hosted edition of NVEIL is open source under the AGPL-3.0 license and available on GitHub. NVEIL Cloud (app.nveil.com) is the fully managed, hosted version of the same platform.


What's the difference between NVEIL Cloud and the self-hosted edition?

NVEIL Cloud is managed for you — zero setup, freemium pricing, always up to date. Self-hosting runs the full platform on your own infrastructure for free, with complete control over your data. Both run on the same deterministic engine.


Where do I find the source code and documentation?

The source code is on GitHub at github.com/nveil-ai/nveil, and the documentation is at docs.nveil.com.


Does NVEIL use my data to train its models?

NVEIL AI does not use your data to train its models. All data you provide is used solely to generate visualizations and analyses.


Can I delete my data after use?

Yes, you can delete your data after use. NVEIL AI allows you to manage your data transparently.


Are there offers for students and educational institutions?

Yes, NVEIL AI offers special offers for students and educational institutions.


Our last news

What's New in NVEIL: Dashboards, Timeline, Choregraph and more !

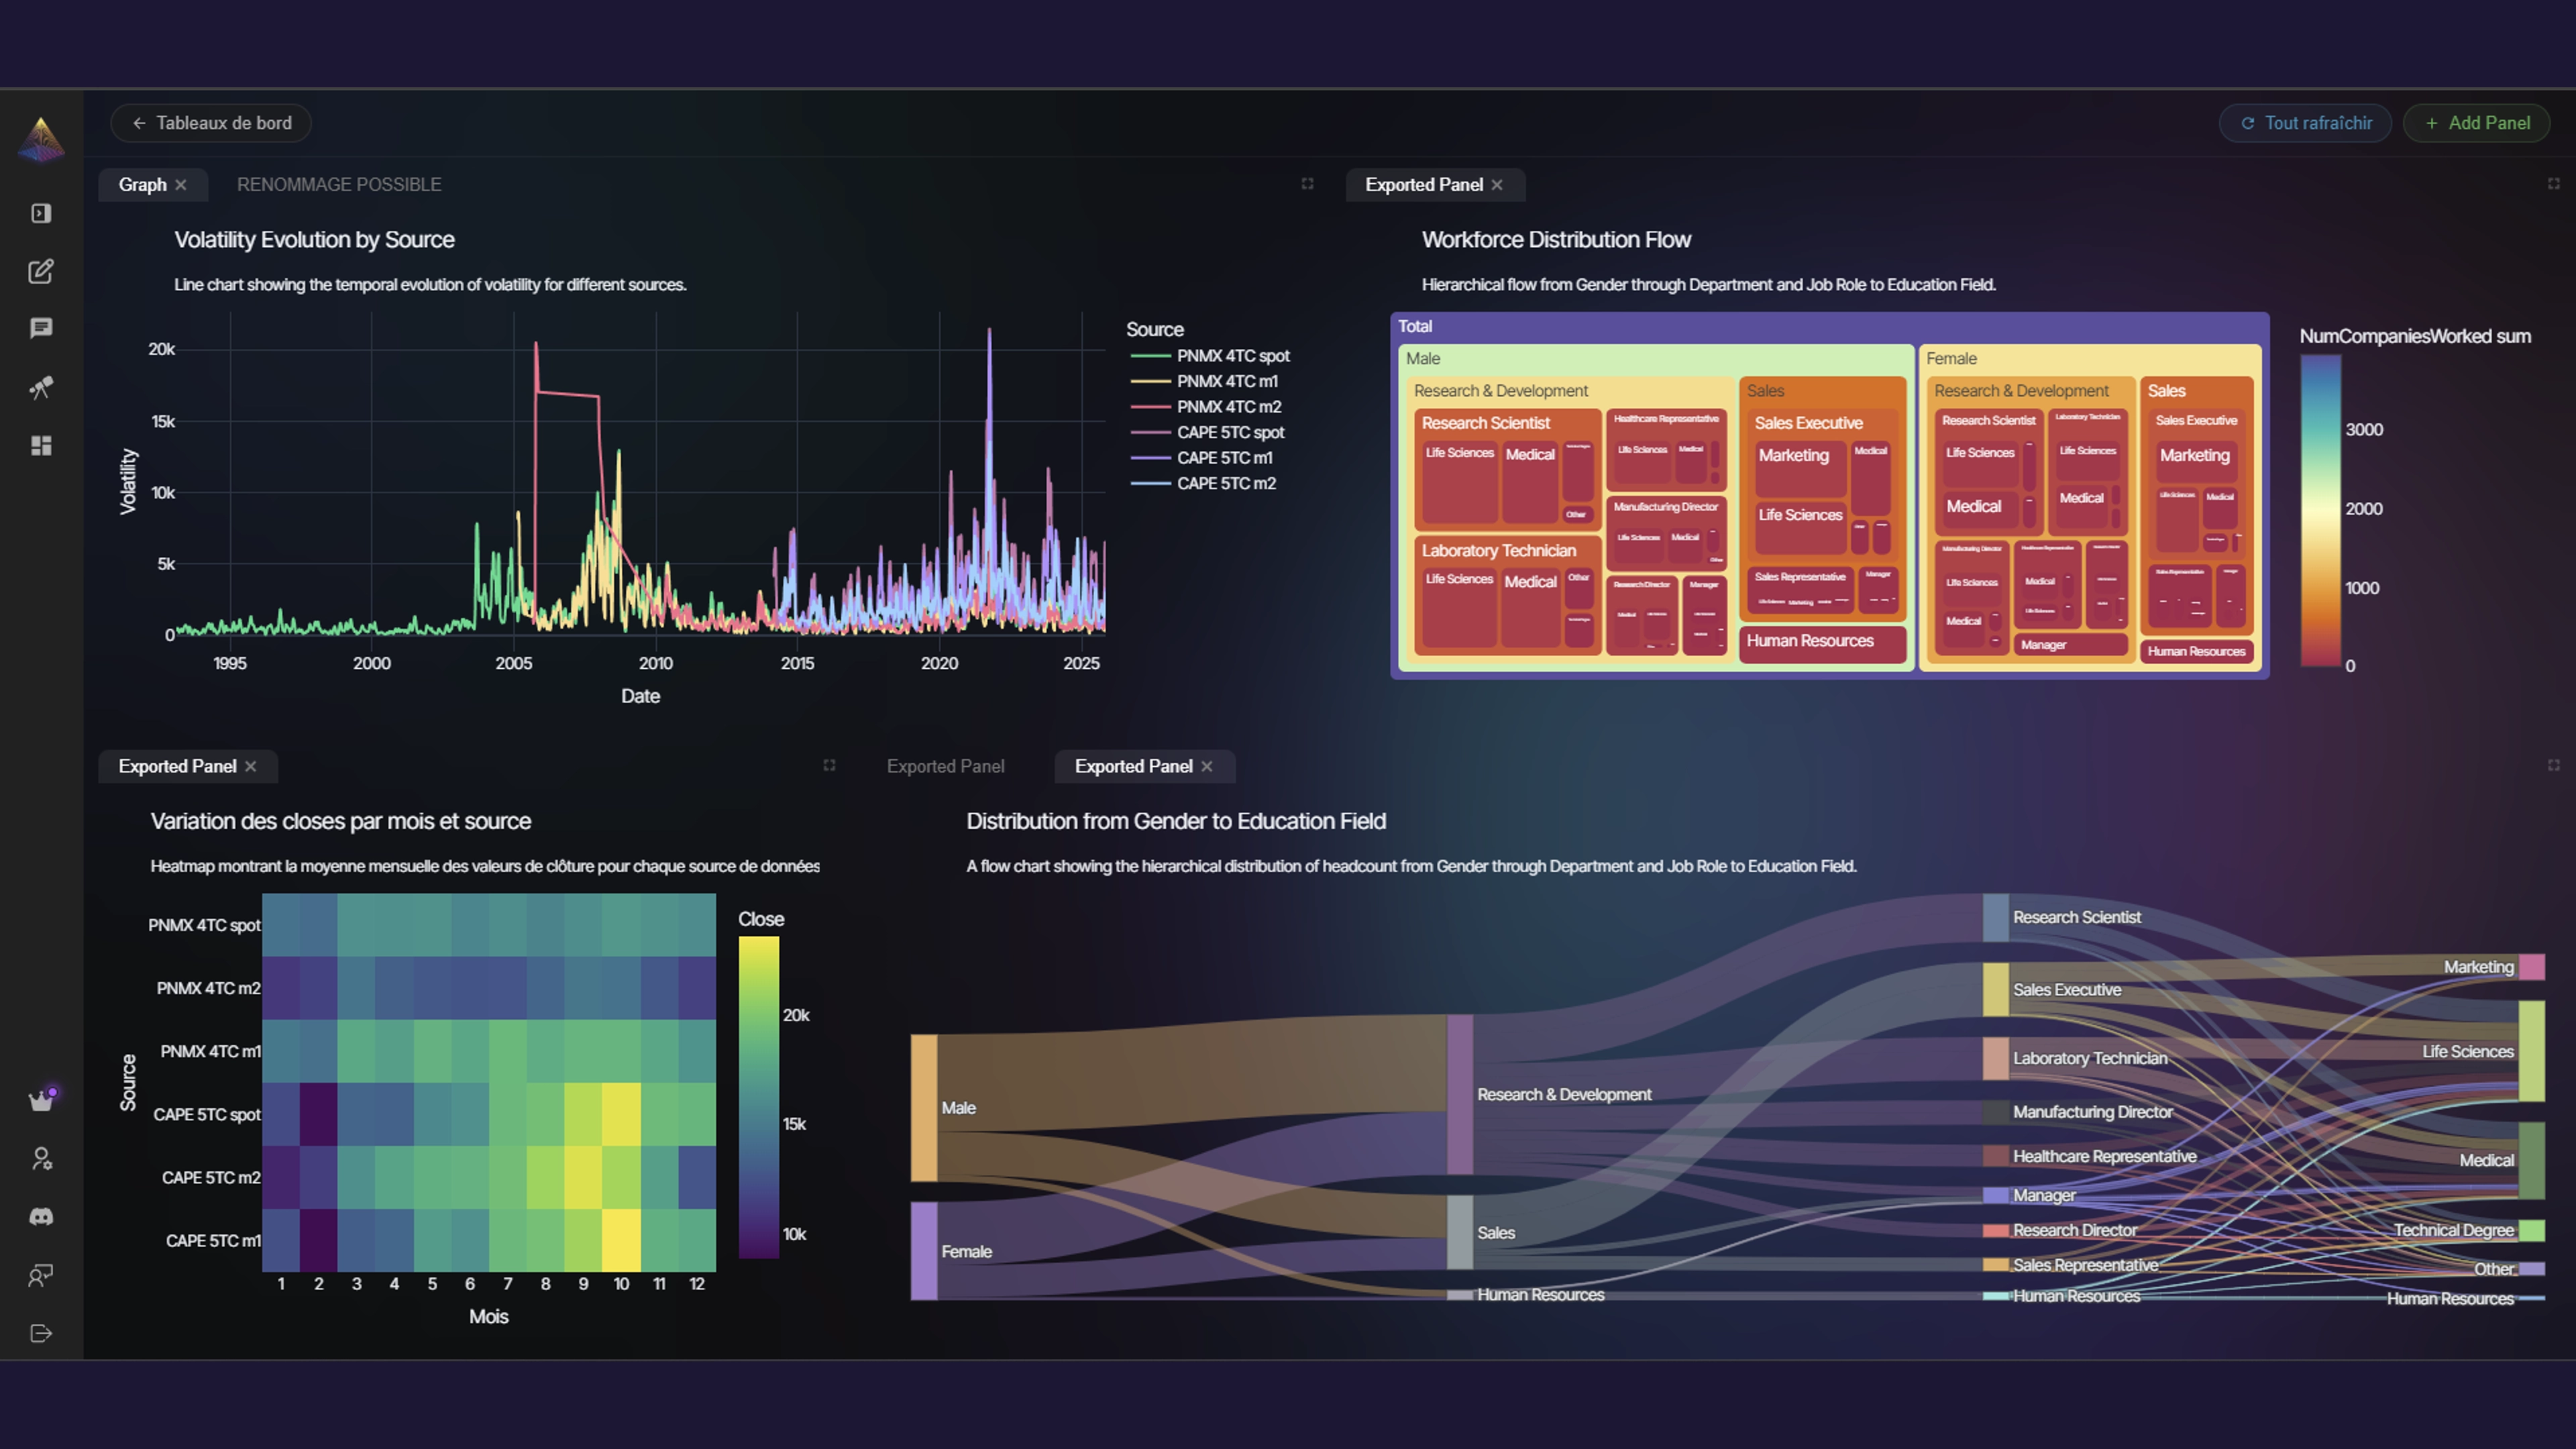
Multi-chart dashboards, choropleth maps, temporal timelines and Choregraph pipelines: what's new in NVEIL's no-code data visualization platform.

Read article ⟶

Blinded by Scale: The Problem of Computational Abundance in the age of Black Box algorithms

We process petabytes yet see nothing. How the Black Box Rush blinds data science — and why Tukey's Exploratory Data Analysis still matters today.

Read article ⟶

The Histogram: From Pearson’s Evolution to Modern Density

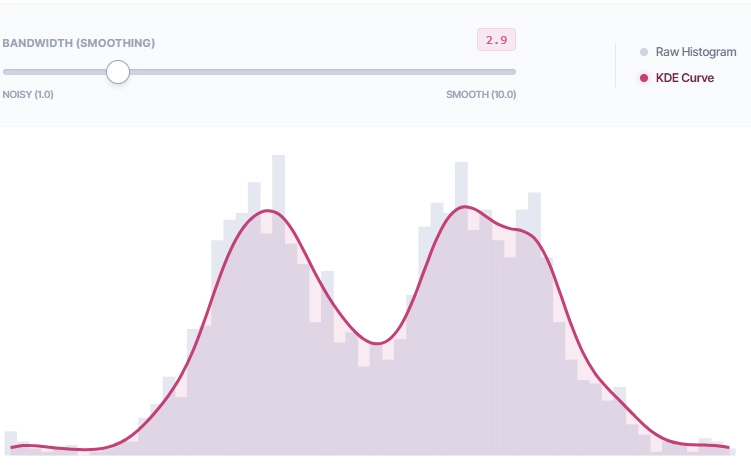
Karl Pearson invented the histogram in 1895, but binning bias can silently distort your analysis. Learn when Kernel Density Estimation reveals the truth.

Read article ⟶
Contact-us
Try NVEIL online.
We look forward to discussing it with you!
  • NVEIL
    C/O SATT Linksium
    31 rue Gustave Eiffel
    38100 Grenoble, FRANCE
  • Contact-us
    info@nveil.com
  • Follow-us on social media

The data collected via this contact form will be used solely to respond to your inquiry.