
Actualités & articles
- 19 DÉC. 2025 En ligne
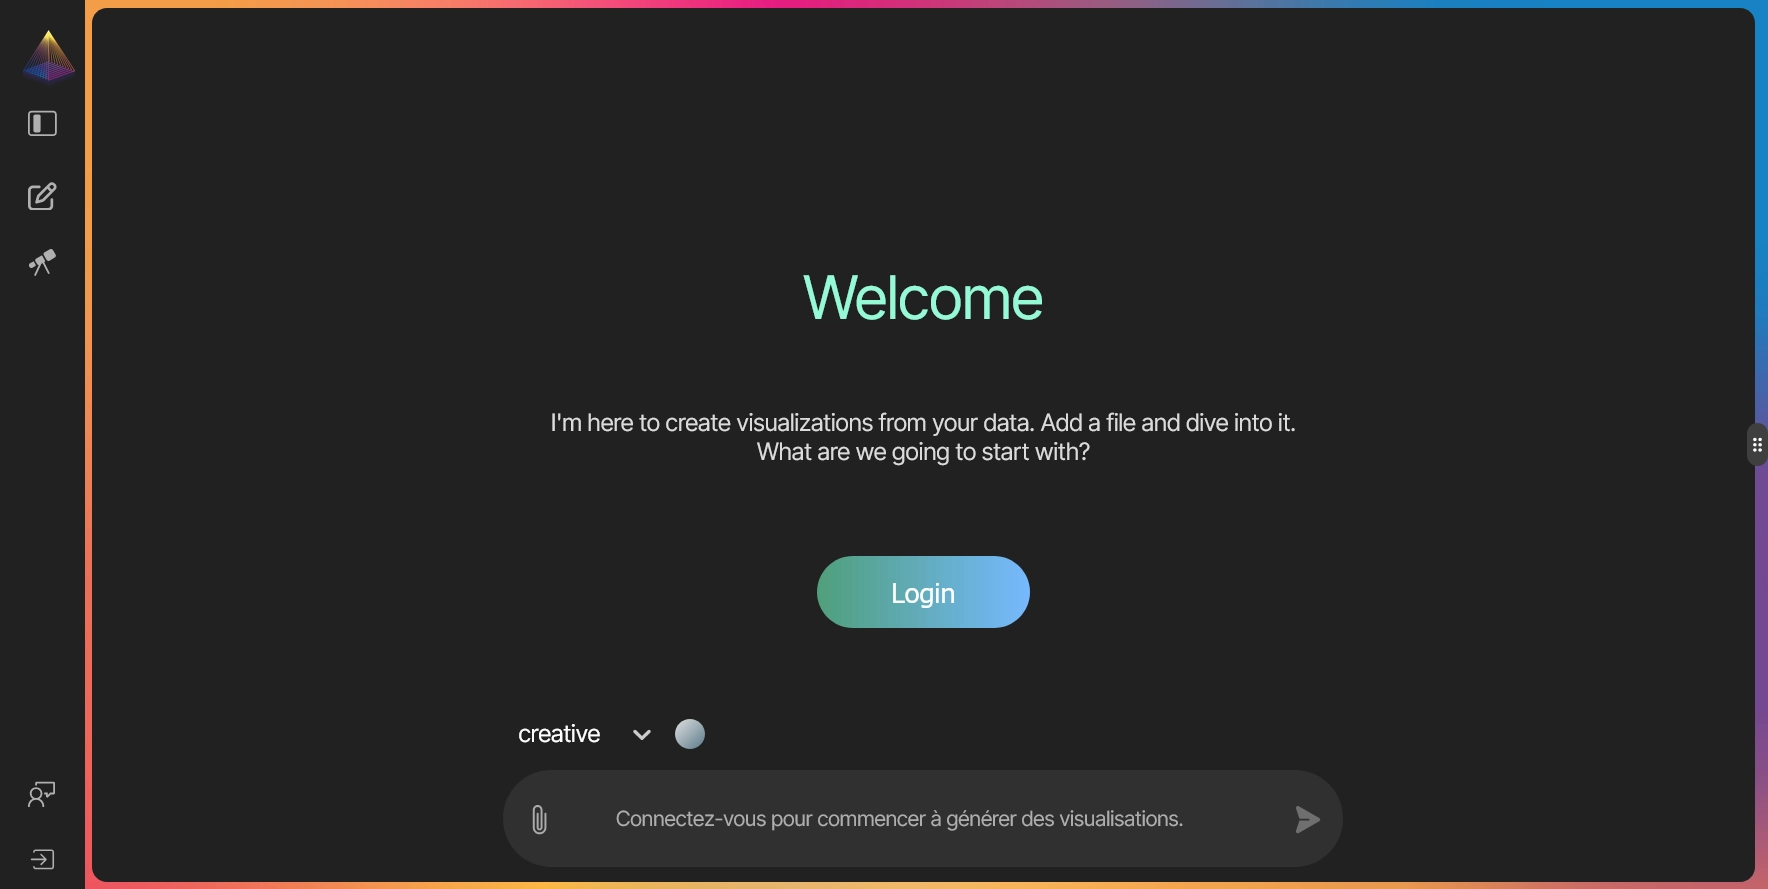
Rendre l'invisible visible : Lancement de la Bêta NVEIL
Rejoignez la Bêta NVEIL. La première plateforme d'IA explicable pour la visualisation de données scientifique et immersive. Transformez vos données complexes en insights 3D interactifs dès maintenant.
En savoir plus ⟶
- Article
- 13 janv. 2026
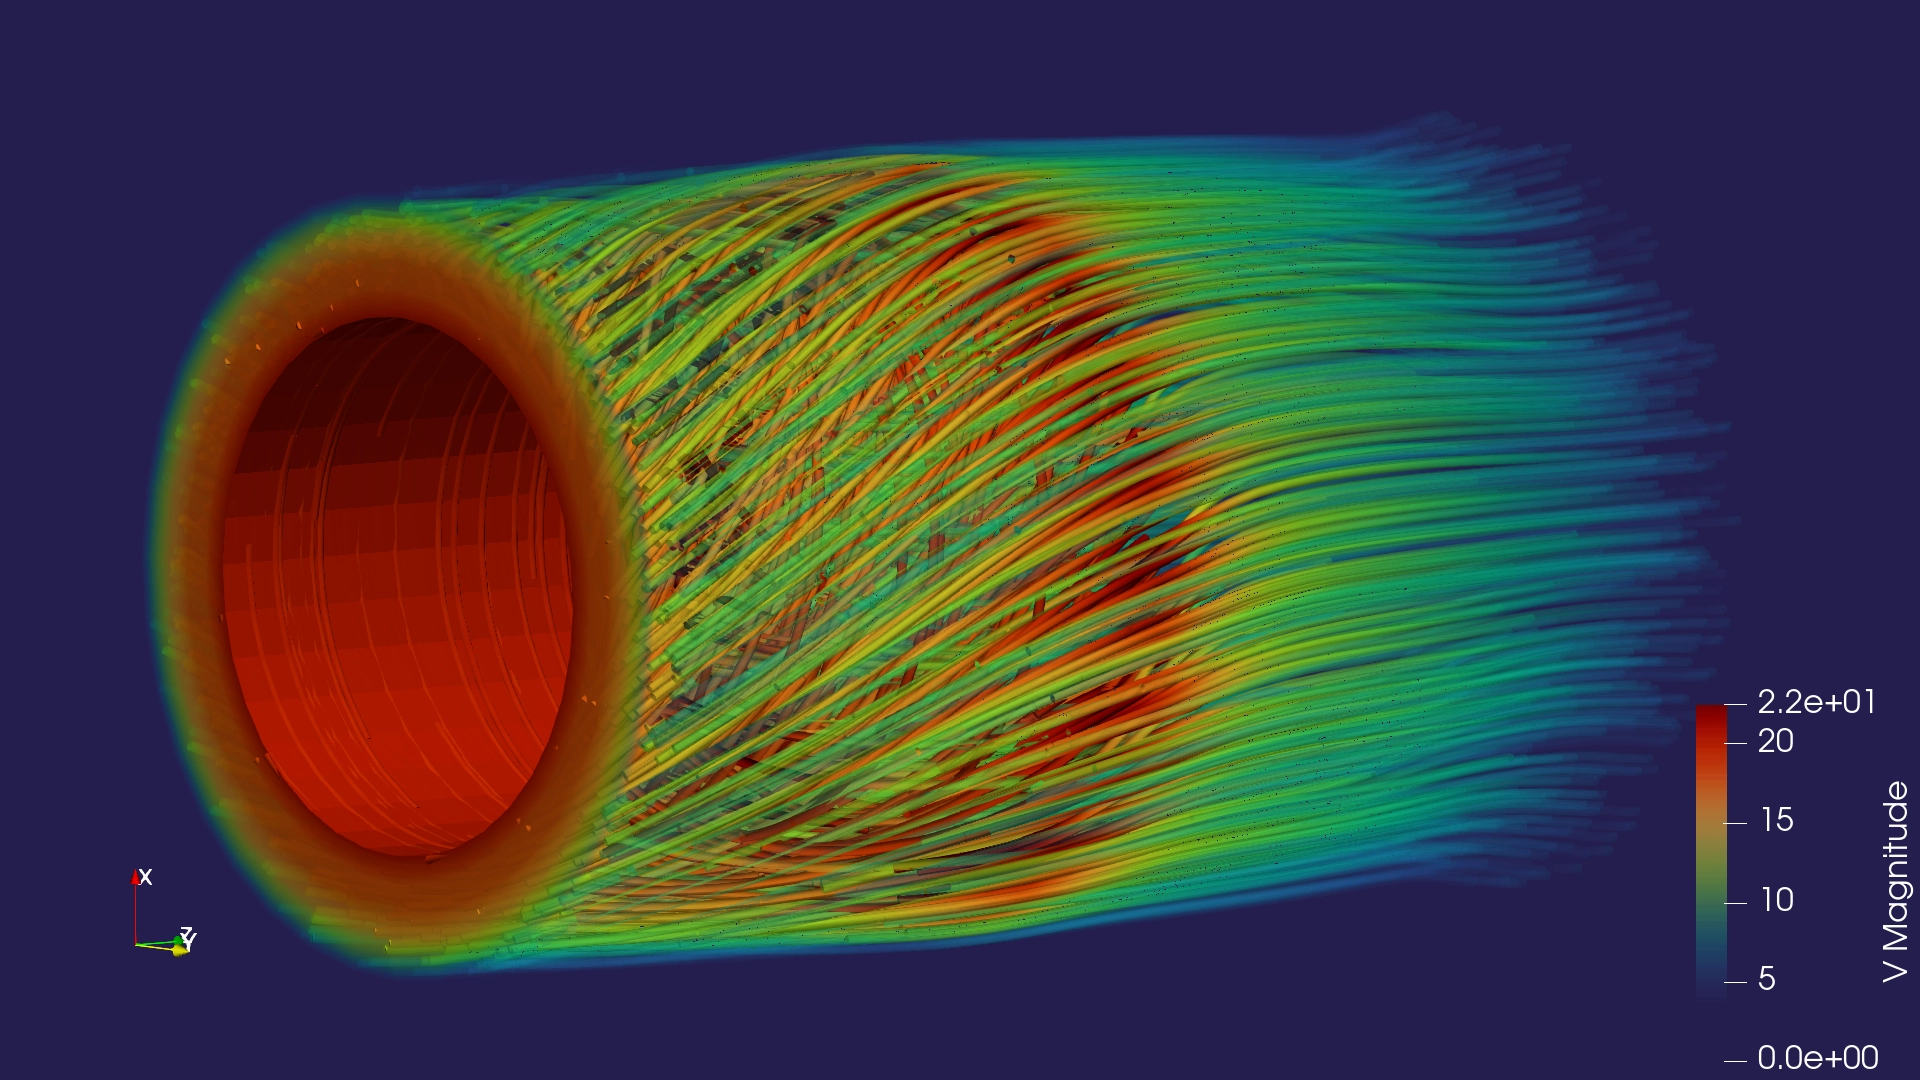
Qu'est ce que la visualisation de données ?
La visualisation transforme les données complexes en informations accessibles, améliorant la compréhension et la prise de décision.
Lire l'article ⟶
- 15 ET 16 OCT. 2024 Paris, France